Market Edge
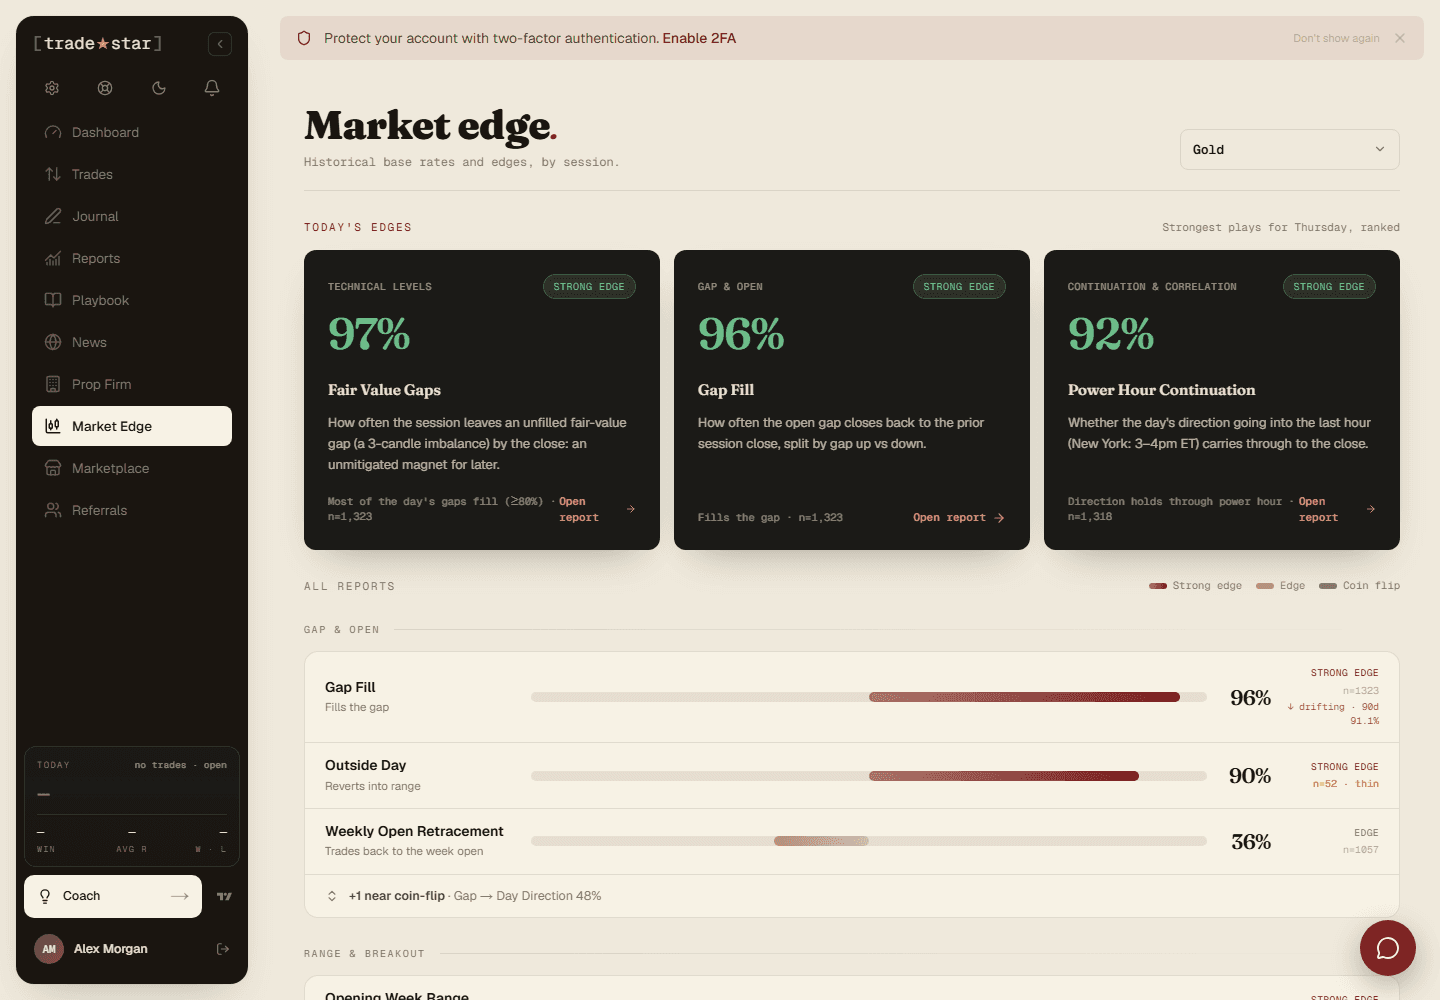
Pre-computed probability reports from years of historical session data, gap fill, ranges, opens, and more, across Gold and the major US indices.
Market Edge answers questions like "how often does the gap fill?" with a real sample size behind every number, built from years of historical session data (not your own trades), across Gold and the major US indices.
Pro feature
Free plan users see an upgrade prompt in Market Edge's place.
Browsing reports
Open Market Edge in the sidebar for a grid of report cards, name, sample size, headline probability, and a fill-meter, for your selected instrument. Search by name or category, switch instruments from the top, reports group into five categories: Gap & Open, Range & Breakout, Continuation & Correlation, Timing & Volatility, and Technical Levels.
Reading a report
Click into any report to filter by session, lookback window, weekday, and report-specific conditions.
Today's edges
Pre-discovered, statistically strong slices of this report, surfaced for today's weekday.
Headline stat
The core probability, always shown with raw counts, e.g. '62 of 100 days.'
Drivers
What correlates with the outcome, with its own sample size.
Seasonality
A monthly breakdown, so you can see whether it holds year-round or only in certain months.
Bookmark a specific filter combination from the saved-reports pills at the top of the library.
Honesty layer
Every stat shows its literal sample size. Under 30 samples gets flagged "low sample, read with caution," and zero samples shows a dash instead of a fabricated percentage. Volume-based reports use feed tick-volume, an approximation of true contract volume.
Want to pull this data programmatically? See the Edge API.
MCP for Claude and Cursor
Connect Claude (web, Code, or Desktop) or Cursor to your TradeStar data. Each client connects a different way, pick yours below.
Edge Lab
Sweep every version of a strategy against years of real sessions, rank what survives your own filters, and find out whether it held up or just fitted the data.