Reports
P&L calendar
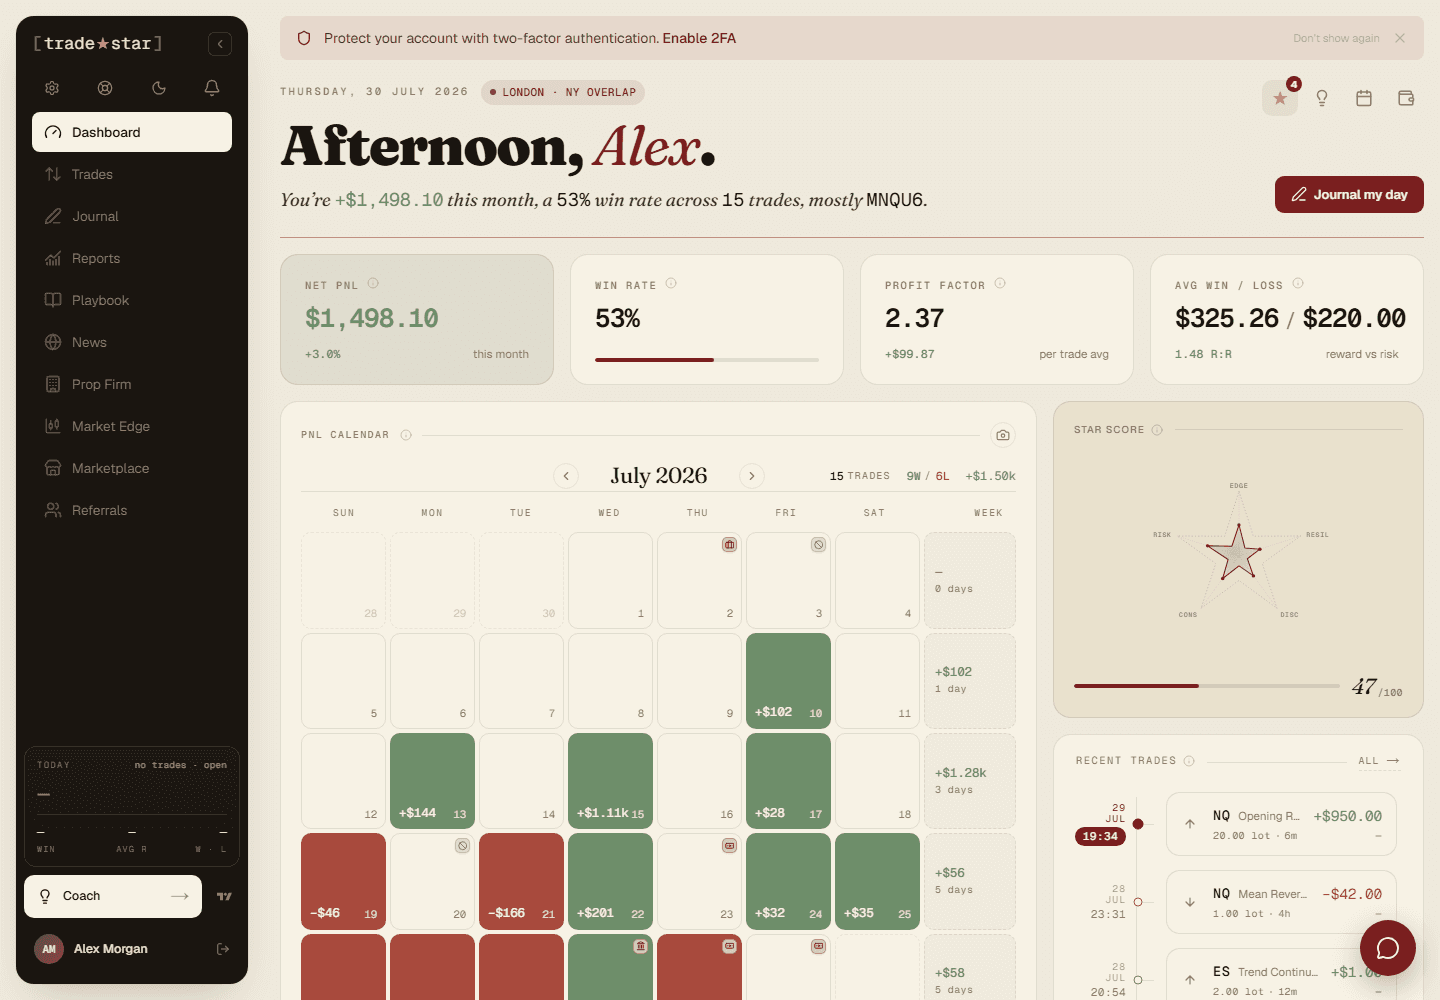
A monthly heatmap of your daily results, colour intensity scales with the size of the day.
The P&L Calendar is a monthly heatmap: each day's cell is coloured green (profit), red (loss), or neutral (no trades/breakeven), with the colour's intensity scaling to the size of the day, a small green day is a soft tint, a big one is vivid.
Drilling into a day
Click any day for a popup with the full trade list, symbol, side, P&L, duration, and links straight through to each trade's detail page or that day's journal entry.
Use the month arrows to navigate; the calendar respects whatever account and date filters you've already set at the top of the page.