Reports page
Eight tabs, one shared filter panel, each tab looking at your trading from a different angle.
Reports is eight tabs sharing one filter panel (date range, account, side, status, symbols, strategy, tags, rating), each tab a different lens on the same filtered trades.
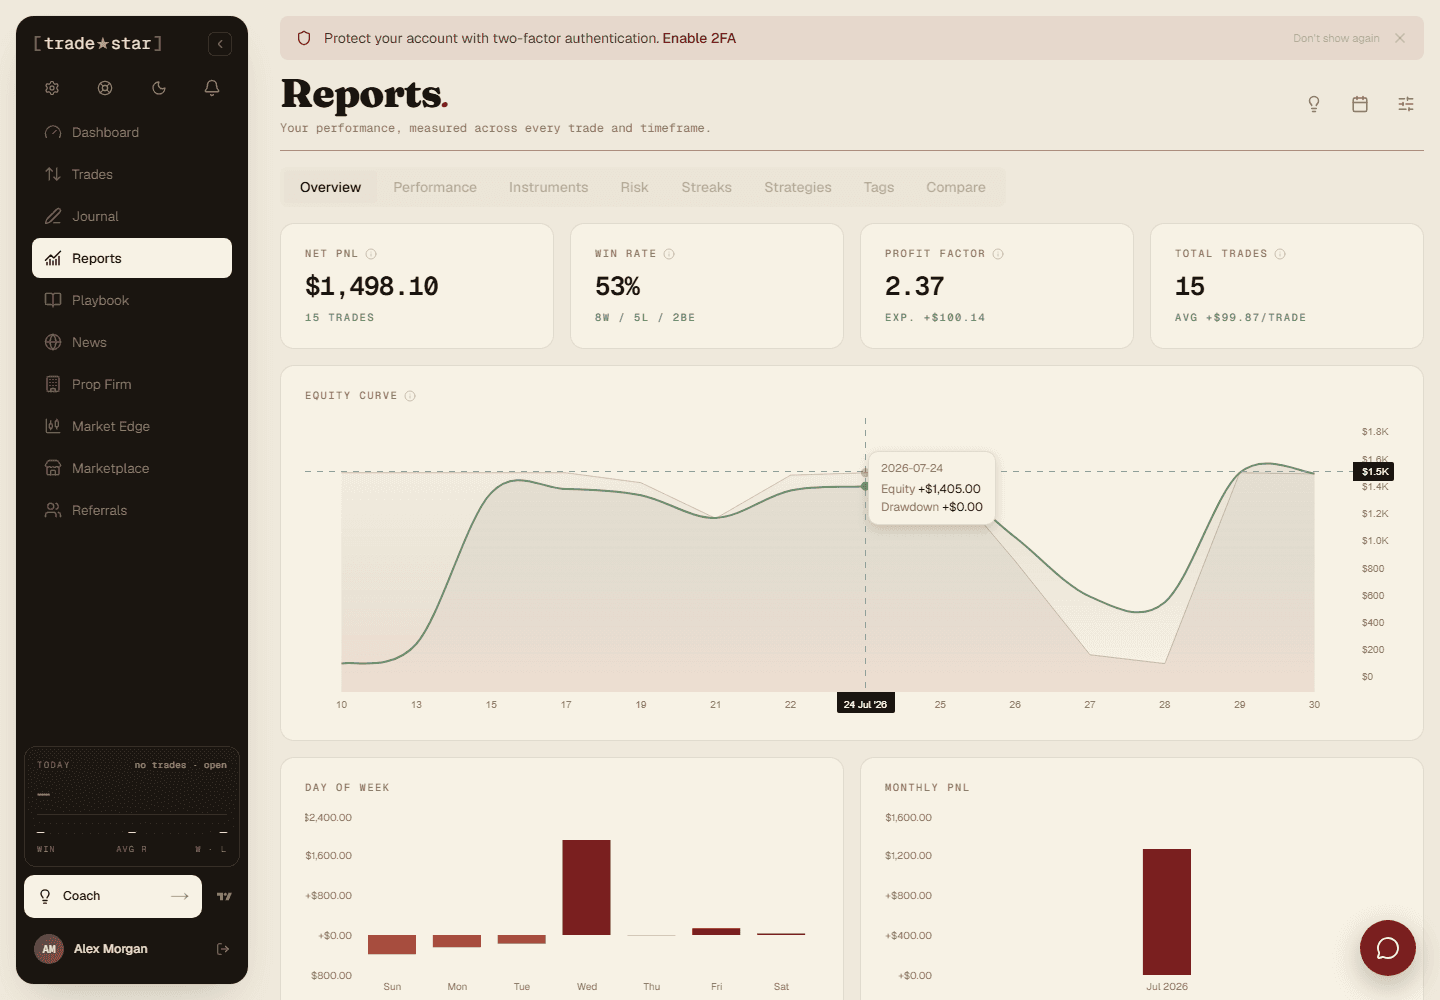
Overview
Total P&L, win rate, profit factor, expectancy, max drawdown, average hold time, everything at a glance.
Performance
Equity curve, daily P&L bars, distribution histograms, time-based breakdowns.
Instruments
P&L, win rate, and trade count per symbol, see what's making or losing you money.
Risk
Risk-reward analysis, R-multiple distribution, drawdown charts, position sizing patterns.
Streaks
Current and longest win/loss streaks, and how your sizing and discipline hold up as a streak runs.
Strategies
P&L, win rate, profit factor, and adherence per playbook, compare strategies head-to-head.
Tags
P&L and win rate per tag, e.g. 'News Event' trades vs 'Breakout' trades.
Compare
Any two filtered views side by side, morning vs afternoon, XAUUSD vs EURUSD, whatever you want to compare.
Pro feature
Reports is Pro-only. Free plan users see the Overview tab; the other six unlock on Pro.