One Good Strategy Will Still Blow Your Prop Account
 丂卩ㄖㄖҜㄚResearch notes
One Good Strategy Will Still Blow Your Prop Account
Why decorrelation — not a better setup — is what actually gets you funded, why it matters far more for prop traders than for anyone trading their own capital, and how I go about finding it.
Let's talk about decorrelation: why decorrelation, not a better setup, is what actually gets you funded. I have never heard anyone else speak about this, and yet it literally halves the time it takes me to pass prop evaluations.
Here is something that took me far too long to accept: a profitable strategy can still blow a prop account. Not a mediocre one. A genuinely profitable one, with a real edge, validated over twelve months of data.
It happens because prop firms don't test whether you're profitable. They test whether your equity curve is smooth enough to stay inside their drawdown rules. Those are two completely different things, and the gap between them is where most funded accounts die.
The fix isn't a better strategy. It's more than one — and specifically, ones that don't lose money at the same time. That's decorrelation, and it's the least glamorous, most important concept in systematic trading.
So let me explain what it actually is, why it matters far more for prop traders than for anyone trading their own capital, and how I go about finding it.
What decorrelated strategies actually are
Decorrelation is not "different strategies." This is the first trap, and I fell straight into it.
Two strategies are decorrelated when their wins and losses don't line up in time. That's the whole definition. It has nothing to do with what they're called or how different the logic looks on paper.
You can run two mean-reversion systems that feel completely separate and discover their losses land on exactly the same days, because they're both short volatility, and they both get run over on the same trend days. Two names, two charts, one risk. Correlated. Useless to you.
Real decorrelation comes from strategies occupying different condition-spaces. Different regimes — one that works in chop, one that works in trend. Different sessions. Different instruments, but only if the mechanism is genuinely different, which I'll come back to, because this one bit me. Different logic types: a fade and a breakout are natural opposites, because the exact market that destroys the fade is the one that pays the breakout.
And here's the part that fits everything else I go on about: decorrelation has to be measured, not assumed. Two strategies that "feel different" can be 80% correlated. You don't get to eyeball it and call it diversified. You compute the correlation of their return streams, or you don't actually know.
Why it matters specifically for prop firms
This is where it stops being portfolio theory and starts being survival.
Most futures prop firms gate you on a trailing drawdown, and the harshest version is intraday trailing. The drawdown floor ratchets up with your unrealised profit. So a runner that goes plus two grand and then pulls back to plus five hundred can breach your account while it's still a winner. You didn't lose. You got stopped out of the evaluation by your own open profit retracing. That mechanic, not the profit target, is why most evaluations fail.
Now think about what a single strategy looks like under that rule. Even a strong system has losing streaks. Four or five losers in a row is completely normal variance, not a broken edge. Over 200 trades it's a non-event. But on a prop account with a trailing drawdown, that one cluster of losses early in the evaluation is terminal. The strategy is fine. The account is dead by trade twelve. The edge was real and the variance still killed you.
This is the bit people miss: the drawdown rule converts variance into a hard fail. On your own capital, a deep drawdown is painful but survivable — you sit through it and recover, because the maths is still in your favour over the long run. A prop firm doesn't give you the long run. It gives you a variance band, and the first time you touch the floor, the game's over regardless of where the edge would have ended up.
Which means the thing you most need to reduce isn't your loss rate. It's your variance. And decorrelation is the most reliable way to reduce variance without throwing away return.
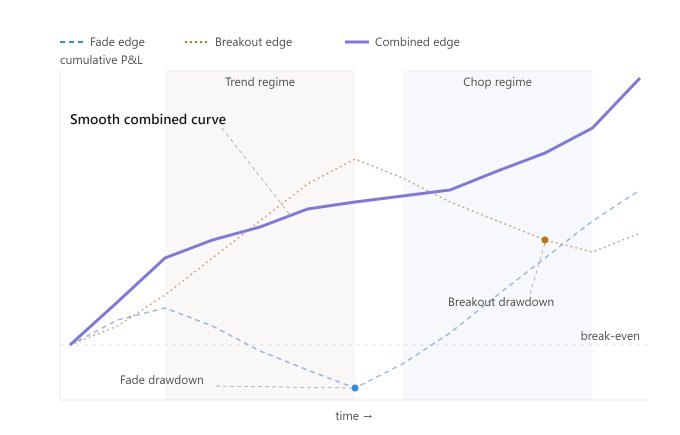
The mechanism is simple. On a given day, strategy A takes a loss while a decorrelated strategy B is flat or up. The combined daily swing is smaller than either strategy alone, so the aggregate equity curve is smoother, so you stay inside the band. Stack enough genuinely uncorrelated edges and the curve flattens out into something a trailing drawdown can't easily catch. This is why Andrea Unger — four-time World Cup champion — runs eighty to a hundred-plus strategies. It's not that he found a hundred brilliant edges. It's that a hundred mediocre, uncorrelated edges combine into one smooth curve, and the smooth curve is the edge. Thirty systems at a profit factor of 1.1 to 1.3, uncorrelated, can produce a system profit factor of 1.4 to 1.5 with a fraction of the drawdown of any one of them.
For a prop trader, that smoothness is the difference between passing and donating another evaluation fee.
There's a second prop-specific angle worth naming: multiple accounts. Once you're running decorrelated edges, you can spread them across accounts, or scale across accounts, without simply stacking the same correlated risk three times. Three accounts running the same strategy is one risk with three times the eval fees. Three accounts running three decorrelated edges is actual diversification.
Real examples, including the one that fooled me
Let me use my own setups, because the failures are more instructive than the wins.
I run an IB Fade — fading initial-balance extensions after a sweep trap — across both the London and the New York sessions. On paper, that's two strategies. Two sessions, separate trades, separate stats. The London version has shown a structural edge across regime changes; a profit factor around 1.5 to 1.8 over twelve months, surviving shifts that killed other ideas. The New York version posts a profit factor over 2.0 in the current high-volatility regime over six months.
So, two profitable fade strategies. Diversified, right?
No. They're the same edge in two costumes. Both fade extensions. Both are, underneath, short volatility. The New York version collapses to a profit factor of roughly 1.0 to 1.17 over the full twelve months; it's regime dependent, only really working from December 2025 onward in the current high-vol regime. And the regime that would hurt the London fade is the same regime that hurts the New York fade, because the mechanism is identical. When extensions stop reverting, both die together. Running them side by side feels like diversification and delivers very little, because their losses are correlated by construction.
I learned the same lesson a second way. I ran an hourly pattern scan and found a clean reversal tendency at 10:00 UK across ES, M2K and NKD — three instruments, same signal, looked like a robust cross-asset edge. It wasn't. It was just the London IB Fade mechanically triggering, showing up three times because the same setup fires across correlated index futures at the same clock hour. Three instruments, one edge. Cross-instrument is not decorrelated if it's the same mechanism firing on correlated markets.
So what is decorrelated? The opposite-regime pairing. A fade like the IB Fade works in ranging and normal-volatility conditions and gets destroyed on strong trend days. A momentum or continuation edge — like the NQ hour 15 signal that survives on NQ specifically, or a clean outside-bar breakout system — does the reverse; it pays on the trend days that murder the fade, and bleeds in the chop the fade loves. Those two lose at different times. Run together, the breakout carries the bad days for the fade and vice versa. That's real decorrelation: opposite sensitivity to the same underlying market condition. Not two fades in two sessions — a fade and its natural enemy, sized to ride together.
How I use TradeStar to find it
Because decorrelation has to be measured, I built the measuring into TradeStar rather than trusting my gut, which had already lied to me twice in the examples above.
The starting point is logging every strategy's trades, then computing the correlation of their return streams. If the London and New York IB Fade losses land on the same days, that correlation is high and the diversification benefit is a fiction — and I want the number telling me that, not a feeling. This is the single check that would have saved me from thinking two fades were a portfolio.
Then there's Market Edge, which surfaces the conditions each edge actually works in — time of day, day of week, the regime it likes, the average distance to your stops and targets.
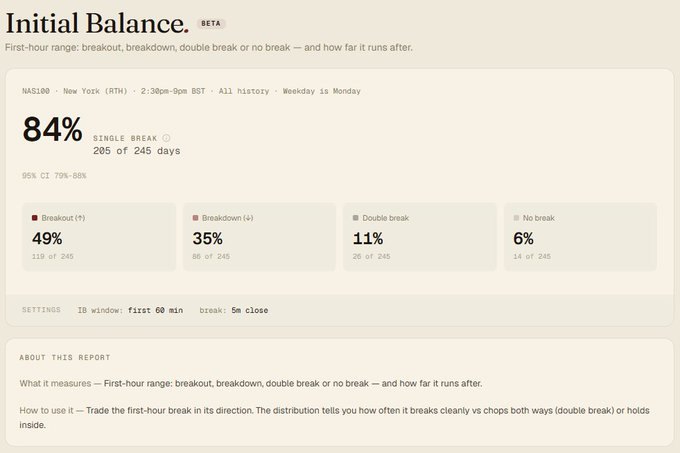
This is how you see the condition-space each strategy occupies. Two edges that light up under the same conditions are correlated whatever they're called. Two that light up under different conditions are genuine decorrelation candidates. More usefully, it shows you your gaps: if every edge you own works in high volatility, Market Edge makes that obvious, and now you know exactly what you're hunting for — something that earns in low-vol chop. You go looking for the specific edge that fills the hole, instead of collecting more variations of the edge you already have.
Prop Passer closes the loop. Before risking an evaluation fee, you model the combined equity curve against a specific firm's drawdown rule — and, crucially, against the right rule, because an intraday trailing drawdown and an end-of-day or static drawdown are completely different survival tests. A portfolio that sails through an EOD model can still breach an intraday trailing one. Better to learn that in the model than with your money.
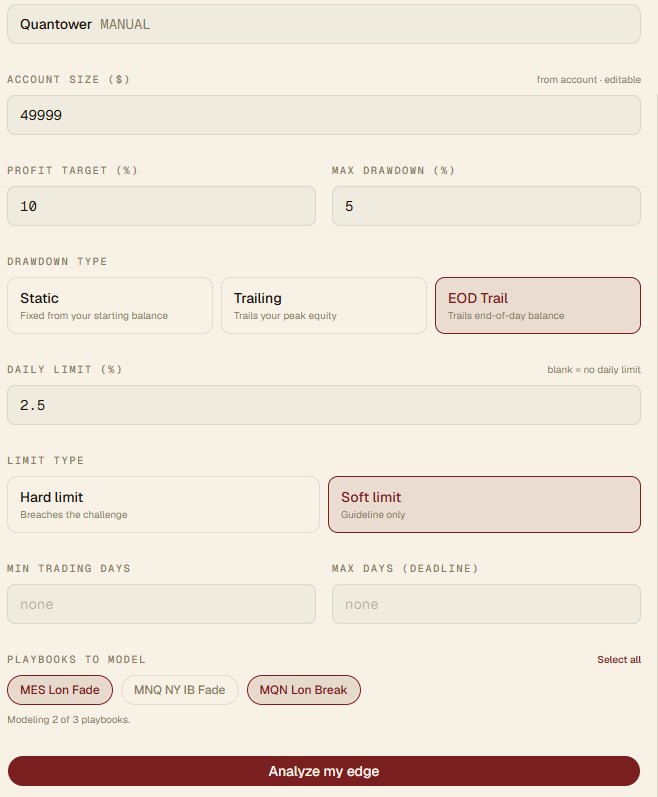
The workflow, end to end: log everything, measure the correlations so you know what you actually hold, use Market Edge to find the regime gaps, build the complementary edge that fills one, then re-test the combined curve against the exact prop rule you're going to trade. Repeat until the curve is smooth enough that variance isn't the thing deciding whether you get funded.
The unglamorous truth
Decorrelation isn't a setup. You can't buy it, copy it, or screenshot it. There's no indicator for it and no guru selling it, because it doesn't demo well — it's portfolio construction, which is boring, mathematical, and impossible to hype.
It's also the thing that separates a strategy that's profitable in a backtest from a portfolio that survives a prop firm's drawdown rule in the real world. One good strategy gives you an edge and a lumpy curve. Several decorrelated edges give you a smooth one — and the prop firm is, whether it says so or not, only testing the curve.
So I don't assume my edges are decorrelated. I measure how they relate, I find the gaps, and I deliberately fill them. Same discipline as everything else I do: the evidence decides, not the story I'd like to believe. It already caught me twice. Measure yours before it catches you.
Every base rate in this piece lives in the Hit Rates library, free to read. Or connect your broker and see which of them your own trading actually survives.