I Tested MrZinc's IB 50 Mechanically
 丂卩ㄖㄖҜㄚResearch notes
I Automated MrZinc's IB 50 and Tested It Properly. Here Is Everything the Data Showed.
Two years of MNQ, both directions, every filter, honest fills. A full technical breakdown of what the pure mechanical version of the IB 50 actually does, and why the answer keeps changing depending on where you look.
Here I'm going to show you the whole thing: the methodology, the bug I had to fix before any of it was trustworthy, every number across every window and both directions, and the conclusion the data forces whether I like it or not.
A note on what this is and isn't, up front, because it matters. I automated the bare mechanical core of the IB 50 and tested it as a pure rules engine. That is deliberately not how MrZinc trades it. He takes his directional bias from SPY and QQQ and layers years of discretion on top, whereas I read direction off the futures and handed a machine the bare bones, which is a deliberately harsher and different thing. I'll come back to it properly at the end. This is a test of the skeleton, run honestly, and reported in full.
How the strategy works
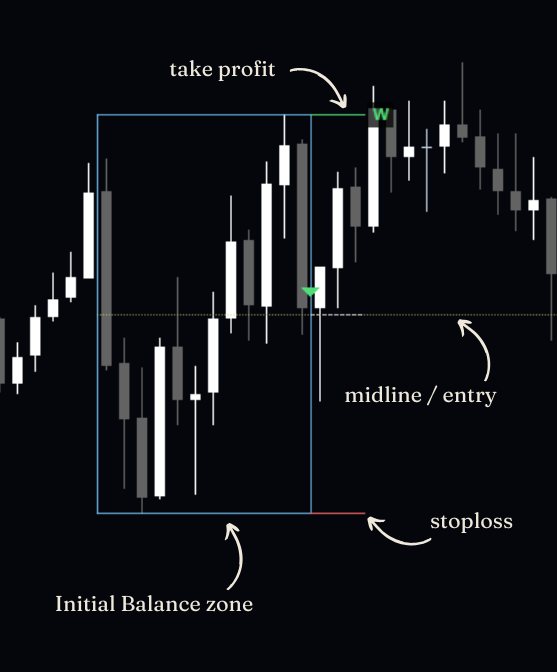
The initial balance is the range that forms in the first hour of the session. Take its high, its low, and the midpoint between them. The mechanical rules I tested are:
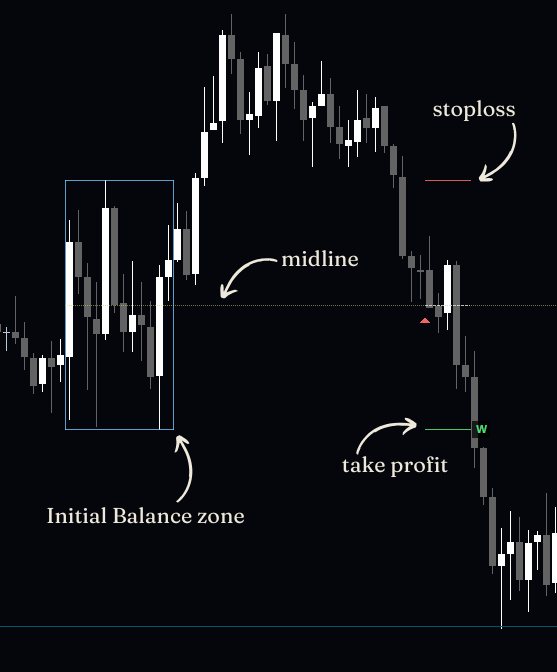
Enter with a resting order at the 50% midpoint. Target the breakout level, the far edge of the range in your bias direction. Stop at the opposite edge. Because the midpoint sits exactly between the two edges, the target and the stop are the same distance away, so the trade is one-to-one by construction. Direction comes from which side of the range prints first: if the low forms first, you bias long and target the high; if the high forms first, you bias short and target the low.
That is the entire mechanical core. No discretion, no confirmation, no judgement. Every day the setup exists, the machine takes it.
The fill problem I had to fix first
Before any number here meant anything, I had to fix something in the backtester, and it's worth a short technical detour because it invalidated my first set of results entirely and it silently affects a lot of backtests people post.
My first run looked spectacular. Profit factors past 5 on the recent windows, win rates near 80%, winners running close to twice the size of the losers. Then I noticed losses that were impossible: a $40 loss on a trade sized to risk roughly $500. With the stop at the far edge of the range, a loss should cost close to the full risk, because price had to travel the whole range to get there.
So I decomposed one. The strategy armed a sell at the midpoint, 28052, stop 82 points away at 28135, sized to risk $493 on three contracts. Clean one-to-one. The backtester then filled that entry at 28133, eighty points away from where the order sat, right on top of the stop. The trade was dead on arrival. Price ticked up a few points, the stop fired, and it booked a $40 loss instead of the intended $493.
The cause: when the initial balance closes with price already past the midpoint, a midpoint limit is sitting on the wrong side of the market and is immediately fillable. The simulator filled it at the most favourable price the bar reached rather than at the order price. That one mechanism manufactured the entire fake edge. Every gifted entry either ran on to target for an inflated, roughly two-to-one winner, or ticked back for a trivial loss. Pad the winners, shrink the losers, all from the same root.
The fix was to switch the entries to market orders, which cannot be gifted a price and fill at what is actually there. Every number below is from that corrected run. Finer candle resolution, for the record, made it slightly worse, which is the proof that resolution was never the cause.
Methodology
So the results are clean and comparable, here is exactly how they were produced:
Instrument: MNQ (Micro E-mini Nasdaq 100). Direction read from MNQ itself, not SPY or QQQ (this matters, see the caveat at the end). Session: NY. Entry: market order on signal, after the artifact fix. Risk sizing: roughly $500 per trade, rounded to whole contracts, which introduces some variation in actual per-trade risk. Windows: most recent 6 months, 12 months, and 2 years, run separately. Both directions tested: continuation (the published logic) and its exact inverse. Day filters tested: the favourable weekday subset for each direction.
All profit and loss figures are in account currency on the sizing above. Treat them as relative, not as a promise of dollars.
What is a real edge here and what is overfit. Read this before the tables.
Everything below splits into two piles, and almost every argument anyone will have about this study comes from mixing them up. So I'm going to separate them now, before you see a single number, and give you the test to check me on it.
A regime edge and a curve fit are not the same thing, even though people use the words as if they were. A regime edge is real and works right now, conditional on market conditions that will eventually change. A curve fit never had an edge at all. It is parameters chosen to flatter past noise, and it fails the instant you trade it forward. One you trade cautiously with a kill switch. The other you throw away. This study contains both, and the good news is they are cleanly separable by a single test.
The test is this: does the result survive without any selection? If you had to choose the days, or the direction, or the window to make a number look good, it is fitted. If the number is already there before you choose anything, it is a measurement. Selection is the tell.
So here is the part that survives the test, and it is the only thing in this entire article I am willing to call an edge. The recent continuation, unfiltered, every trade, every day, one direction, nothing optimised, is positive: a profit factor of 1.15 over the last twelve months across 167 trades. Nothing in that figure was chosen to produce it. I did not pick the days. I did not pick the direction after seeing the result. I took everything. That is the regime edge, and it is also faint, a slight lean rather than a fat edge, which is exactly what an honest regime edge usually looks like when nobody has tortured it.
And here is the part that fails the test, which I am telling you plainly rather than burying for someone to dig out later: every eye-catching number in this study is overfit. The filtered runs at profit factors of 2.91 and 4.34, the win rates past seventy percent, all of them exist only because I selected the winning days from inside the very window I then measured. That is choosing the variable and the sample together, which is the textbook definition of a curve fit. I am not offering those numbers as an edge. I am offering them as the thing that looks like an edge and is not, because that contrast is the entire point of the piece.
You do not have to take my word for which is which, and that is what makes this watertight rather than just another claim. Take any filtered headline number and check whether its chosen days still win in a different window. They do not. The favourable days reshuffle, as the weekday section will show you in a moment. Now take the unfiltered twelve-month number and try to find the selection hiding inside it. There is none. That asymmetry, selection everywhere in the big numbers and nowhere in the small one, is the proof, and you can run it yourself.
There is also a condition under which I will declare this edge dead, stated in advance, because a regime edge comes with one and a curve fit never does. The recent unfiltered result is the live signal. The two-year unfiltered result, which is breakeven sliding into loss, is the floor the live signal decays toward when the regime turns. The day the recent number converges on that floor, the regime has rolled over and the edge is gone, and I am out. That is the kill switch, named before the fact, and you can hold me to it.
One last thing, because it squares this with something I have said before and someone will otherwise wave around as a contradiction. I have written (here) that I trust a six-month backtest more than a ten-year one, and here I am calling six-month numbers overfit. Both are true, and the difference between them is the whole lesson: trust recent data to tell you the regime, never to tell you which parameters to set. The recent unfiltered signal is the regime talking, and I trust it. The recent filtered parameters are a curve fit wearing the regime's clothes, and I do not. Same window, opposite trust. Knowing which is which is the only skill that matters here.
Read the tables below through that lens. The dull, un-selected numbers are the real ones. The gorgeous, selected ones are the trap.
The mechanical IB 50, continuation direction
This is the strategy as published, traded mechanically. Here is every window, unfiltered and filtered:
Window | Days | Trades | Win rate | Profit factor | Net | Max drawdown | Avg win | Avg loss | Worst losing streak |
|---|---|---|---|---|---|---|---|---|---|
6 month | all | 70 | 50.0% | 1.22 | +2,798 | −3,590 | 451 | −371 | 6 |
6 month | Mon/Tue/Thu | 42 | 71.4% | 2.91 | +9,161 | −1,436 | 466 | −401 | 2 |
12 month | all | 167 | 50.9% | 1.15 | +5,003 | −5,928 | 463 | −418 | 6 |
12 month | Mon/Tue/Thu | 98 | 62.2% | 1.88 | +13,594 | −2,584 | 475 | −415 | 4 |
2 year | all | 345 | 47.0% | 0.92 | −6,340 | −13,430 | 463 | −445 | 8 |
2 year | Mon/Tue/Thu | 203 | 50.2% | 1.03 | +1,474 | −12,328 | 465 | −455 | 6 |
Read the unfiltered rows first. Over six and twelve months the bare strategy is modestly positive, profit factors of 1.22 and 1.15. Over the full two years it turns into a net loss, a profit factor of 0.92 and a drawdown of more than thirteen thousand. As a trade-everything mechanical system, it does not stand on its own. That is exactly what you'd expect from taking every setup with no selectivity.
Now the filtered rows. Concentrating on the favourable weekdays improves every window, and recently the improvement is dramatic: the twelve-month filtered version more than triples its net and lifts the profit factor to 1.88. But notice what happens as the window lengthens. Over two years the same filter only drags the strategy from a loss up to roughly breakeven, a profit factor of 1.03. The filter helps. It does not manufacture a durable edge on its own.
A warning about those weekday filters
The filter is real, but the specific days are not stable, and this is the single most important caveat in the whole study.
Over the last twelve months, the continuation edge concentrates on Monday, Tuesday and Thursday, with Wednesday and Friday bleeding. Hence the Mon/Tue/Thu filter. But run the weekday split over the full two years and Thursday flips from one of the better days to one of the worst. The favourable days reshuffle depending on the window you measure. Filter to the recent winners and the recent backtest looks superb, precisely because you selected the days from inside that window. Stretch the test and the selection stops holding.
This is the same trap as everything else here, one level down. It isn't just which direction pays that moves with the regime. It's which days, too.
The inverse: dramatically different
Here is the experiment the filter work pointed me towards. If the strategy loses money on certain days, maybe price is reverting on those days rather than continuing, which means the inverse, fading the same setup, should make money exactly where the original fails. So I flipped the direction and tested it identically.
Window | Days | Trades | Win rate | Profit factor | Net | Max drawdown | Worst losing streak |
|---|---|---|---|---|---|---|---|
6 month | all | 70 | 50.0% | 0.82 | −2,798 | −7,436 | 5 |
6 month | Wed/Fri | 28 | 82.1% | 4.34 | +6,080 | −423 | 1 |
12 month | all | 167 | 49.1% | 0.87 | −5,003 | −8,622 | 6 |
12 month | Wed/Fri | 71 | 63.4% | 1.63 | +7,180 | −3,908 | 8 |
2 year | all | 345 | 53.0% | 1.08 | +6,340 | −8,622 | 6 |
2 year | Wed/Fri | 146 | 56.8% | 1.23 | +6,754 | −4,837 | 8 |
Look at the unfiltered inverse against the unfiltered original, window by window. Over twelve months the continuation makes around five thousand and the inverse loses almost exactly that. Over two years it flips completely: the continuation loses 6,340 and the inverse makes 6,340. They are near-perfect mirrors, which makes sense, since one is the other turned upside down. But the point is which one is profitable depends entirely on the window.
The filtered inverse tells the same story with the days flipped. Where continuation likes Monday, Tuesday and Thursday, the fade likes Wednesday and Friday, the very days continuation bleeds on. Filtered to its own favourable days, the inverse is the cleaner of the two over the full two years, a profit factor of 1.23 against the continuation's 1.03. But that, too, is a thin edge selected with hindsight.
What the data actually says
Hold the two piles from the top of this article in mind, because the tables fill them both.
The regime edge is the thin, un-selected recent lean: continuation is modestly positive over the last twelve months because, right now, the initial balance tends to continue. That is real and it is conditional. The proof that it is only conditional is the inverse. Over two years, when the market tended to revert instead, the inverse is the profitable one and continuation is the loser, near-perfect mirrors of each other. The profitable direction is not a property of the strategy. It is a property of the regime, and it rotates.
Everything else, the filtered profit factors near 3, the win rates past 70%, the favourable-day selections in both directions, is the overfit pile. It looks like edge and it is selection. Stretch any of it past the window it was chosen in and it decays toward the unfiltered breakeven, which is the floor and the kill signal both.
So mechanically, this is not a system. It is a faint, rotating regime lean with a great deal of curve-fit dressing piled on top, and the useful skill is telling the dressing from the lean. That is a more honest and more durable thing to walk away with than a profit factor would have been.
What I did not test, and why it matters
I tested the bare mechanical skeleton, and MrZinc does not trade the skeleton.
He takes his daily directional bias from SPY and QQQ rather than the futures, deliberately, because overnight action contaminates the futures open, which is exactly the open my direction read is based on. He uses SPY and QQQ alignment to filter the day and sits out when they disagree. He layers in weekday data, range filters, a front-run rule, and years of discretion on top. I removed every one of those inputs and handed a machine the bones.
So nothing here says the IB 50 doesn't work. It says the pure mechanical core, with the direction read off the futures and no discretionary filters, has no fixed directional edge on MNQ once you fill it honestly, and that day filters help but don't create one. His discretion may well be the part that carries the whole thing. That is precisely the part I didn't test, and it would be unfair to read this as a verdict on his method. It isn't. It's a verdict on automating the bones of it and nothing more.
The real takeaway
The strategy was never the most useful thing I found. The most useful thing was the process: a fake edge with a profit factor over 5, manufactured entirely by a backtester's fill model, that I would have published if I'd trusted the export. The fix exposed a thin, regime-dependent reality underneath, where the profitable direction and the favourable days both rotate with the market and any short window flatters whatever you'd already decided to believe.
If there's one thing to take from all of this, it's that the export is not the truth. Decompose the trades that look wrong, fill your orders honestly, and test across enough history to see the regime change. The flattering numbers are exactly where the lies hide.
Every base rate in this piece lives in the Hit Rates library, free to read. Or connect your broker and see which of them your own trading actually survives.