The Maths Nobody Selling You a Course Will Show You
 丂卩ㄖㄖҜㄚResearch notes
The Maths Nobody Selling You a Course Will Show You
Prop firms are a business model that relies on people failing. Here is the structural, mathematical way to give yourself the best odds — the part the affiliate crowd skips because it doesn't end in a signup link.
Prop firms are a genuine opportunity for an aspiring trader. I don't think they're ideal long-term partners, but short of having five figures to sink into your own funded account, they're a near-essential stepping stone. For most people they're either an opportunity or a necessary evil.
But never lose sight of what they are: a business model. And that model relies on people failing challenges.
Despite your timeline showing everyone getting paid obscene money daily, the reality is that the overwhelming majority of people who attempt trading are not profitable. Prop firms capitalise on that with their "challenge" phases — evaluations structured to be genuinely difficult to pass, even if you have a real edge.
That's not a conspiracy, it's simply the maths of the business: failed evaluations and resets are part of the revenue.
So this article isn't motivation. It's the structural and mathematical way to give yourself the best odds — the part the affiliate crowd skips because it doesn't end in a signup link.
You need an actual edge
For everything below, I'm going to assume you're profitable, and by profitable I mean evidenced, not felt. A minimum of around 200 trades, logged, whether from backtesting, paper, or live trading elsewhere. Enough that you can analyse the data and trust the shape of it.
If you don't have that, no sizing technique on earth passes you. You'll just fail more slowly and more expensively. Edge first. The rest is execution of the edge.
Read the drawdown rules before you read the profit target
This is the bit almost nobody tells you, and it matters more than the target.
Not all drawdown limits are the same animal, and the type changes the difficulty enormously:
Static drawdown — a fixed floor that never moves. The easiest to plan around, because the maths below holds cleanly.
End-of-day trailing — the floor trails your balance up at the close of each day. Harder, because banking profit raises the line you can fall back to.
Intraday trailing — the floor trails your peak equity in real time, including unrealised profit. Brutal. A trade that goes well and then comes back can breach you even on a winning day. I would advise avoiding these at all costs.
I've tested strategies against both, and the trailing drawdown structures were close to unpassable at any risk size that also finished the evaluation inside a sensible timeframe, because the floor chases you up exactly as you try to make progress. Before you pay for anything, read which type you're being sold. The profit target is the headline; the drawdown structure is the actual exam.
Everything below assumes a static floor. If yours trails, treat the numbers as a best case and size down further.
Size from your worst real streak, not from a vibe
Here's the standard advice you'll see everywhere: "Got a $2,000 drawdown limit? Just risk $100." That's twenty losses of room — conservative, sure. It's also a great way to make passing take far longer than it needs to, which on a trailing or time-limited evaluation can itself cause failure.
The better approach uses your own data. Say your logged history, from your own trading, at whatever size you happened to be running, shows that your worst losing run drew down about $2,500, off a five-loss streak.
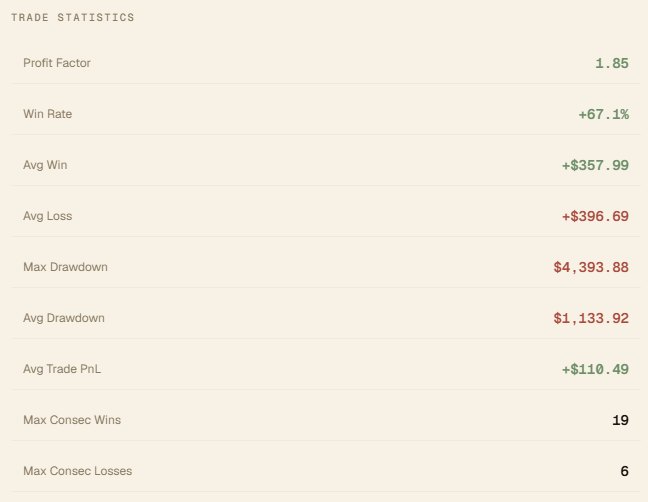
That's your empirical worst case from 200-plus trades. We don't size at the level you traded then; we take that streak — five losses in a row — as the realistic bad run, and re-size it to fit the prop's floor.
Build in a small buffer beyond your worst observed run. So plan for a six-loss streak against a $2,000 floor:
$2,000 ÷ 6 = $333 per trade. Knock off ~10% for fees and slippage → ~$300 risk per trade.
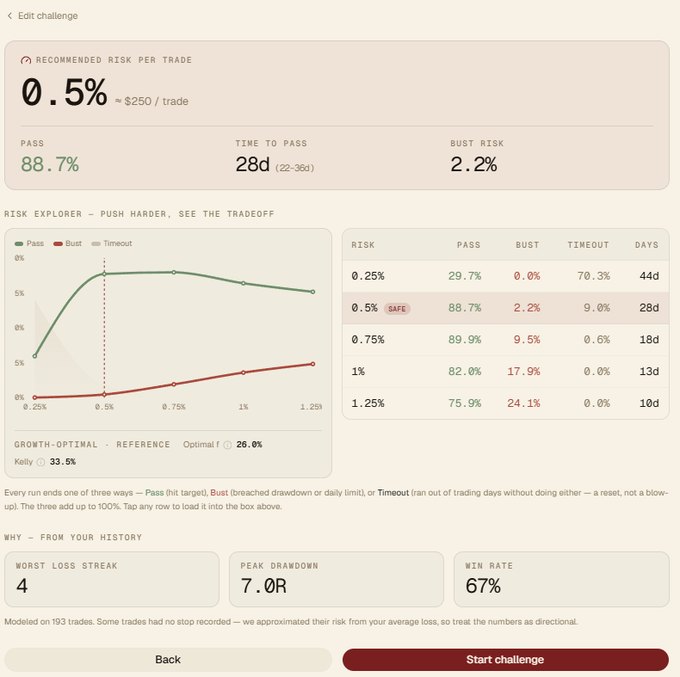
That sizes you to survive a losing run worse than anything you've actually had, while still being aggressive enough to pass in reasonable time. It's anchored to your statistics, not a round number someone guessed.
This is where low win-rate, high-R strategies get less comfortable for evaluations: longer losing streaks are normal for them (more on that below), so the same logic forces much smaller risk — your $50, $100 territory — and the equity curve is lumpier, which fights consistency and drawdown rules harder.
It's not that they don't work; it's that they're a worse fit for the evaluation structure specifically. Personal choice, but worth knowing going in.
Variance. The streak is coming whether you like it or not
This isn't a bulletproof formula. It's an optimal-ish way to pass faster while staying aligned with your stats. Variance is always there.
Here's the part people underestimate: how common losing streaks actually are. Over a 200-trade sample, a few things jump out. At 50% win rate, an eight-loss streak is essentially a coin flip at 32%, and a six-streak is near certain at 80%. At 40%, a ten-loss streak shows up more than a third of the time. Even at a strong 60% win rate, a seven-loss run happens nearly one in five samples. Your sizing has to survive the row, not the average.
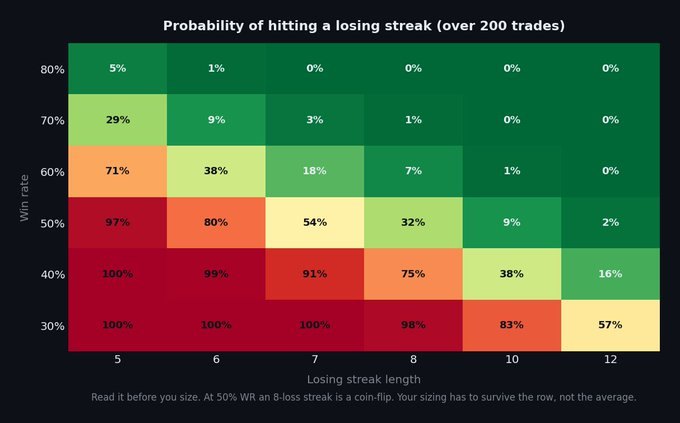
Two honest caveats, because the table is a model:
It's horizon-dependent. Over 200 trades, a six-loss streak at 80% win rate is rare (~1%). Over a full trading career of thousands of trades, it becomes likely. So "you'll hit it eventually" is true over a lifetime, not over one evaluation. Size for the evaluation's length, but don't kid yourself that it can never happen.
It assumes independent trades. Real losses cluster, regimes turn, and your bad trades bunch up in the bad conditions rather than spreading out politely. That means real-world drawdown can exceed the naive streak maths. Another reason the buffer matters.
I prefer to size from my own data rather than the generic table, because win rate alone doesn't capture your edge — your real sequence, with its real clustering, is the purest input. But if you don't yet have enough of your own data, the table is a perfectly reasonable place to base a risk number instead.
The bottom line
You don't beat a prop challenge with grit. You survive its drawdown structure long enough for a positive edge to compound. That means: have a real, evidenced edge; read the drawdown type before the target; and size from your own worst realistic streak plus a buffer, not from a comfortable round number.
Do that, and your odds of passing go up significantly — and usually faster — versus picking a risk figure on vibes.
It's not a guarantee, nothing involving variance is, but it's the difference between playing the maths the structure is built around, and donating your evaluation fee one round number at a time.
Every base rate in this piece lives in the Hit Rates library, free to read. Or connect your broker and see which of them your own trading actually survives.