How I Built an 80% Win Rate Strategy That Makes $6k a Week
 丂卩ㄖㄖҜㄚResearch notes
How I Built an 80% Win Rate Strategy That Makes $6k a Week
Everyone sells you the setup. Almost nobody teaches you to find your own. Here is the exact loop I ran to build mine, with the data behind every number.
The strategy wins about 80% of the time and clears around $6,000 a week. That is the real, logged number, not a projection, and I am going to show you the boring machine that produced it, because the machine is the part you can actually copy.
If you missed it, you can read the article where I broke down this exact strategy here.
Here is the difference between the accounts selling you setups and what I actually do. They hand you a trade. "Buy here, target there, this works 79% of the time." And sometimes it does.
But you never learn why, you never learn whether it still works on your ticker in your session, and the day it stops working you have no idea, because you were never holding the data. You were holding a hand-me-down. I would rather teach you to find your own.
An edge is just a base rate you can prove
Strip away the mystique and a trading edge is one thing: a pattern that resolves the same way often enough, on enough history, that betting on it pays. Not a feeling. A base rate, with a sample size, that you can go and check.
Take the initial balance, the first hour's range. Every session builds one, and once it is set, price does a small number of things: it breaks one side and runs, it breaks both and chops, or it stays inside. That's it.
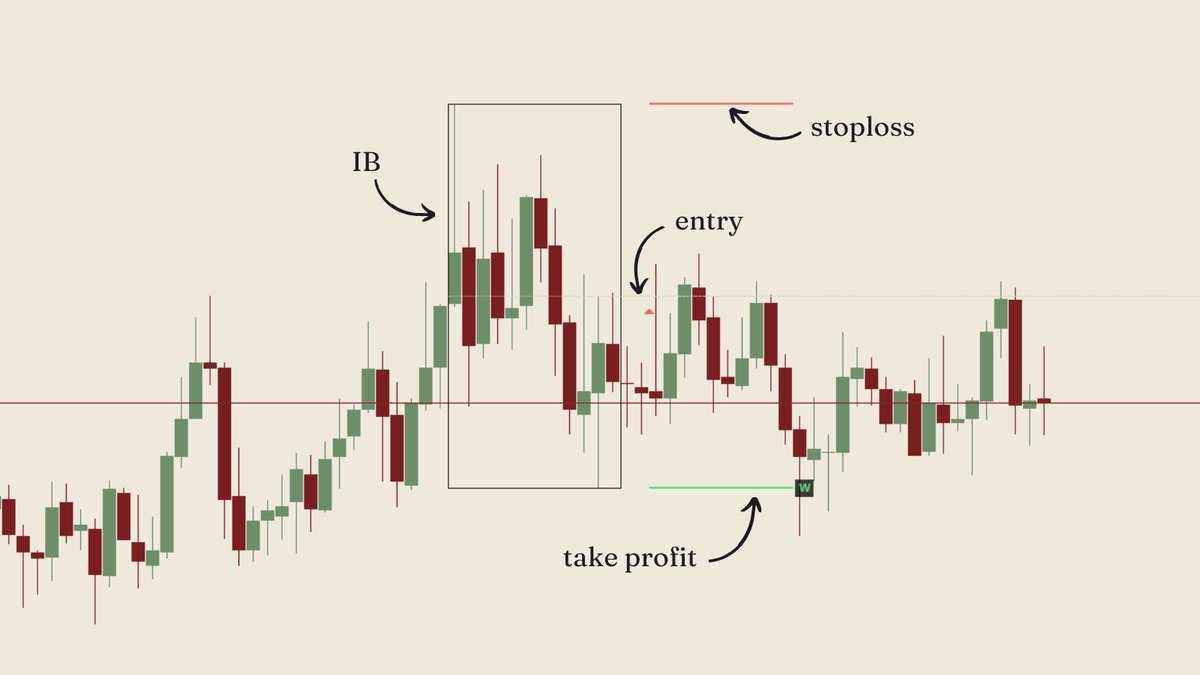
What the data actually says
Here is NQ's initial balance, pulled from Market Edge in TradeStar, New York session, full history, 1,301 sessions.
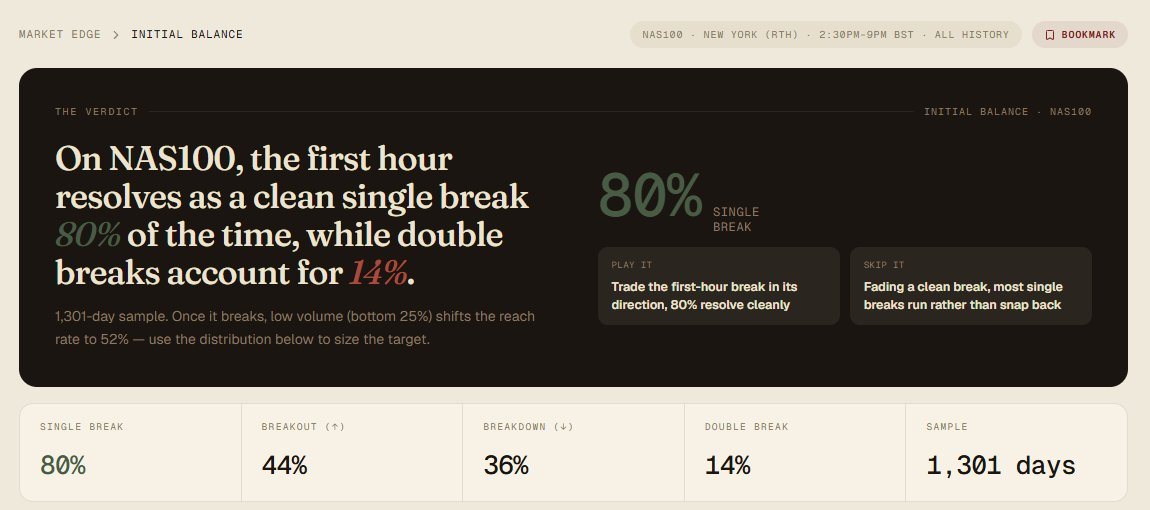
The first hour resolves as a clean single break 80% of the time. One side gets taken and price runs. Double breaks, where it pokes both sides and chops back inside, account for only 14%, and a completely dead first hour, no break at all, is just 7%.
That is the whole edge in one line: on NQ in New York, the first hour picks a direction and goes four times out of five. That is a genuinely tradeable base rate, and it is the number this entire strategy is built on.
It gets sharper when you slice it. A small first-hour range, the bottom 25% by size, raises the clean-break rate to 73% against a 63% base on that cut. Low volume in the first hour drops it to 52%.
So not every session is equal, and the data hands you the filter: quiet, tight first hours resolve cleaner than loud, sprawling ones. That split is the difference between a trade and a coin flip, and you would never find it by eye.
Then it tells you how far it runs, which is how you set targets instead of guessing them. After a break up, 57% of those days reach half the range beyond the break level, 22% reach a full range, 10% reach one and a half. That is a distribution, not a hope. You bank the high-probability move and let a runner reach for the tail.
None of that is my opinion. It is 1,301 days of NQ in the New York session, and you can pull the same report on your ticker, your session, in about a minute.
The loop that turns a report into an edge
A base rate on a screen is not money yet. Here is the actual process, and it is the whole thing I am handing you.
Find it. Open Market Edge, pick your instrument and the session you trade. It shows you, in plain percentages, what price tends to do: how often the first hour breaks one way and runs, which direction it leans, and how far it usually travels after. You are just reading numbers off a screen, looking for one that is clearly better than a coin flip.
My rule of thumb: a strong single number sits well clear of a coin flip, and it holds across a year, six months, and three months, not just the long lookback. A rate that only shows up on all-history and has faded recently is not an edge, it is a memory.
Tune it to you. This is the part the setup-sellers cannot give you, because it is specific to how you trade. Change the session to the one you actually sit for. Change the IB window. Slice by weekday. The numbers move, and somewhere in there is the version that fits your hours and your instrument better than any generic setup ever could. I have tuned mine around the sessions I know. Yours will be different, and that is the point.
Validate it. A base rate tells you the market has a tendency. It does not tell you that you can capture it after entries, stops, costs and slippage. So you take the tuned idea and you test it, on real data, before a penny of size. If it survives, you have something. If it dies, you have saved yourself an account and a story.
Find, tune, validate. That is not a secret. It is just work, and most people will not do it, which is precisely why it is an edge.
Where the IB50 comes in
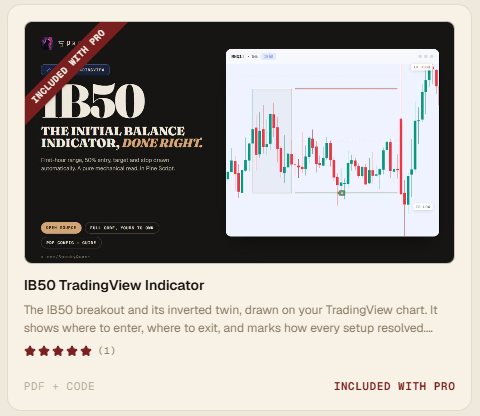
I have already run that loop on one setup and packaged the result: the IB50. It takes the initial balance and trades the 50% midpoint, the one IB entry where your risk equals your reward, sized off the data above. Pro subscribers get the indicator that draws it on your chart, as well as the guide that explains every rule and why it exists.
But read this carefully, because it is the whole philosophy: the IB50 is my specific tuned version, not the only version. I built it around what I know works for how I trade. What I am actually giving you is the machinery to build your own, the indicator, and Market Edge underneath it so you can pull the exact base rates and refine the setup around your session instead of inheriting mine.
That is the difference. A signal-seller gives you a fish. This gives you the rod, the map of where the fish are, and the method to prove they are really there.
What's coming
Over the next few weeks I am going to publish more of these, different setups, different edges, each one taken through the same loop and handed over with the data behind it. All of it free for Pro subscribers.
Not signals to follow. Tested methods to run and refine yourself, with the reports that let you check every claim I make.
Because that is the only kind of edge worth having: the one you validated yourself and can watch for the day it stops working. Everything else is a hand-me-down.
If you want the tools, the indicator, and the data to start finding your own edges, that is what Pro is. Explore Market Edge and the IB50 in TradeStar Pro →
Every base rate in this piece lives in the Hit Rates library, free to read. Or connect your broker and see which of them your own trading actually survives.