I Tested the ICT Silver Bullet Mechanically
 丂卩ㄖㄖҜㄚResearch notes
I Tested the ICT Silver Bullet Mechanically
And the results might surprise you.
Regular readers know how I feel about ICT concepts, and putting that aside, the problem with testing them is that the definitions are subjective by design.
Bias filters, structure shifts you recognise when you see them, discretion at every step. Subjective rules cannot be backtested, and rules that cannot be backtested cannot be falsified, which is convenient for the people selling them. But enough of that. Let us get to the numbers.
So I did what I always do. I turned the Silver Bullet mechanical: every rule written down, every threshold fixed, no judgement calls anywhere in the chain.
Then I ran it on 12 months of NQ data, and separately measured the raw phenomenon underneath it across 368 window days of NAS100 history.
The short version: the raid-and-fail phenomenon is real, more real than I expected. The famous 10am window is still a losing trade. But that is not the full story.
What the Silver Bullet claims
The setup, as taught: inside a fixed one-hour window (the famous one is 10:00 to 11:00 New York time), price raids a pool of resting liquidity, an old high or low, fails, and reverses.
You enter on the fair value gap left by the reversal and target the opposite side. Claims for it range from 55 to 65% win rates at 1:3, through 63.5% at 1:1, up to numbers that are not mathematically possible.
It is probably the most hyped named setup in retail futures right now.
Turning it mechanical
The canon leaves every important knob loose, and in at least one place contradicts itself: the most-read guide to the setup places the stop beyond the FVG candle in its checklist and "just past the swept liquidity" in the author's own comments.
That looseness is not a small problem. It is the reason no honest test of this setup existed before now, and it is why the first job was writing rules a machine can execute:
- A raid is price trading at least 2 ticks beyond one of eight objective levels: previous day high and low, overnight high and low, London session high and low, opening range high and low.
- The fail is a 1-minute close back inside within 5 bars.
- The entry is the first fair value gap of at least 8 ticks forming in the reversal direction within 15 bars, taken at the near edge of the gap.
- Stop beyond the raid's extreme.
- One setup per window.
- No management, because the setup as sold specifies none, and every rule added is a place to hide.
Where my translation differs from the canon: I excluded the higher-timeframe bias filter, the premium and discount check, and structure-shift confirmation, because each is a discretionary judgement, and I excluded intraday swing highs as raid targets because with them, every window contains a valid setup and the claim becomes untestable by construction.
Every one of those decisions was published before the results were. If you think a translation is unfair, that was the time to say so.
The phenomenon: raids really do fail and reverse
First, the Market Edge report, measured across every window-day in the sample, with no trade logic attached.
In the AM window, a qualifying raid occurs on 90% of sessions, and when it fails, the reversal extends 50 ticks before the raid resumes 77% of the time. The PM window: 73%. London: 69%. Split by direction, failed raids on highs reverse slightly more reliably than raids on lows in the morning, and the pattern flips in the afternoon.
Note what that number is and is not. It says that after a failed raid, the market usually keeps pushing away from the raided level for at least 12.5 points before it comes back. It does not say a trade wins 77% of the time, and it is not measured against a coin flip, because the race geometry favours the reversal side by construction.
It is a description of behaviour, and the behaviour is real: the market does punish failed raids. On this, the ICT crowd is right, and I am happy to say so.
The famous window loses anyway
Now the backtest: the rules above executed on 12 months of NQ 1-minute data, fixed dollar risk, honest fills, bracket exits only.
The 10am window, the flagship, the one the win-rate claims are about: 108 trades, 38.9% win rate at 1:1, a net loss of roughly ten thousand dollars, four positive calendar months out of the thirteen the sample touches.
The confidence interval's upper bound does not reach breakeven. Targeting the opposing liquidity pool instead, the canonical exit, made it worse: 35.2%. The community's 63.5% claim is not optimistic. It has the wrong sign.
The afternoon window, the one nobody writes guides about: 45 trades, 60% at 1:1, net positive, eight of those thirteen calendar months green.
Before anyone frames that sentence, hold it still: 45 trades is a small sample, the interval runs from 46% to 74%, and this result is suggestive, not proven. Anyone selling you a 60% win rate on 45 trades is selling you variance with a bow on it. But it survived every bug fix, and it points the same way the raw base rates do.
Full results, all four runs
$500 fixed risk per trade, bracket exits only, no management. Sample July 2025 to July 2026. Dollar figures scale with your risk size; win rate, profit factor, and confidence interval do not.
In risk units: the AM window lost roughly 20R over the year; the PM window made 9R against a maximum drawdown under 2R.
Best model: PF 1.52, 60% WR, total $4,535.
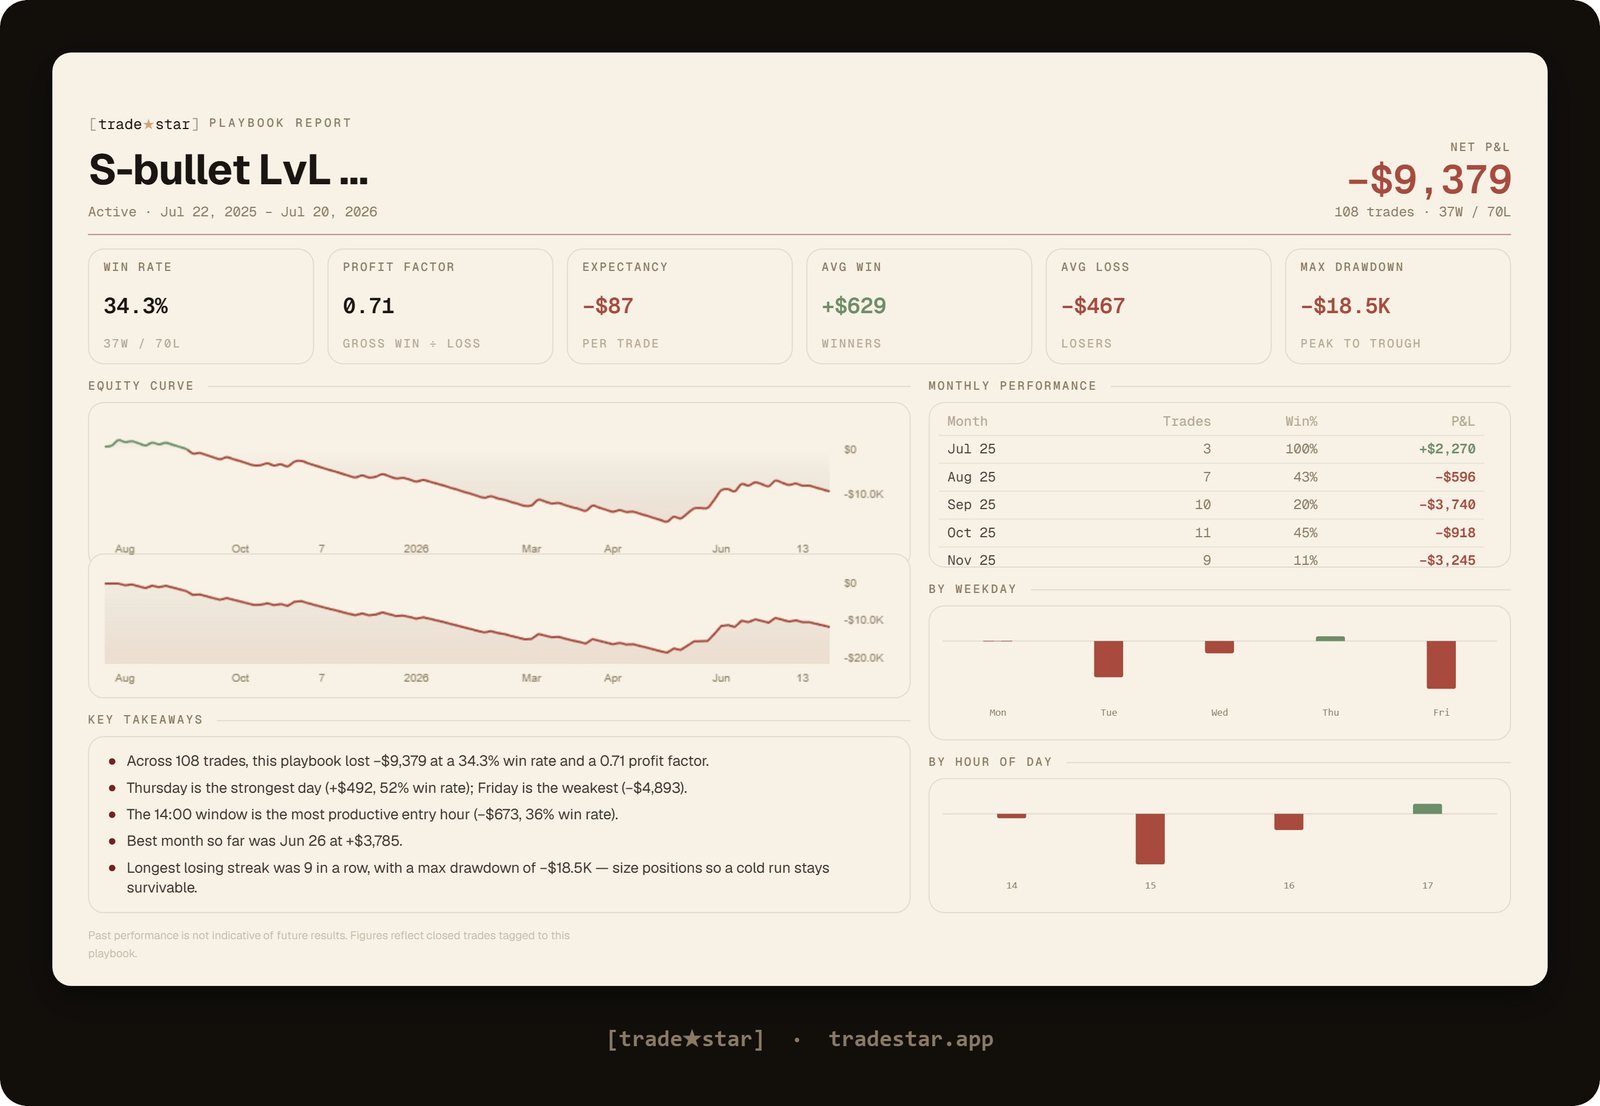
Nearest level, AM window. 108 trades, 34.3% win rate, profit factor 0.71, net loss of $9,379.
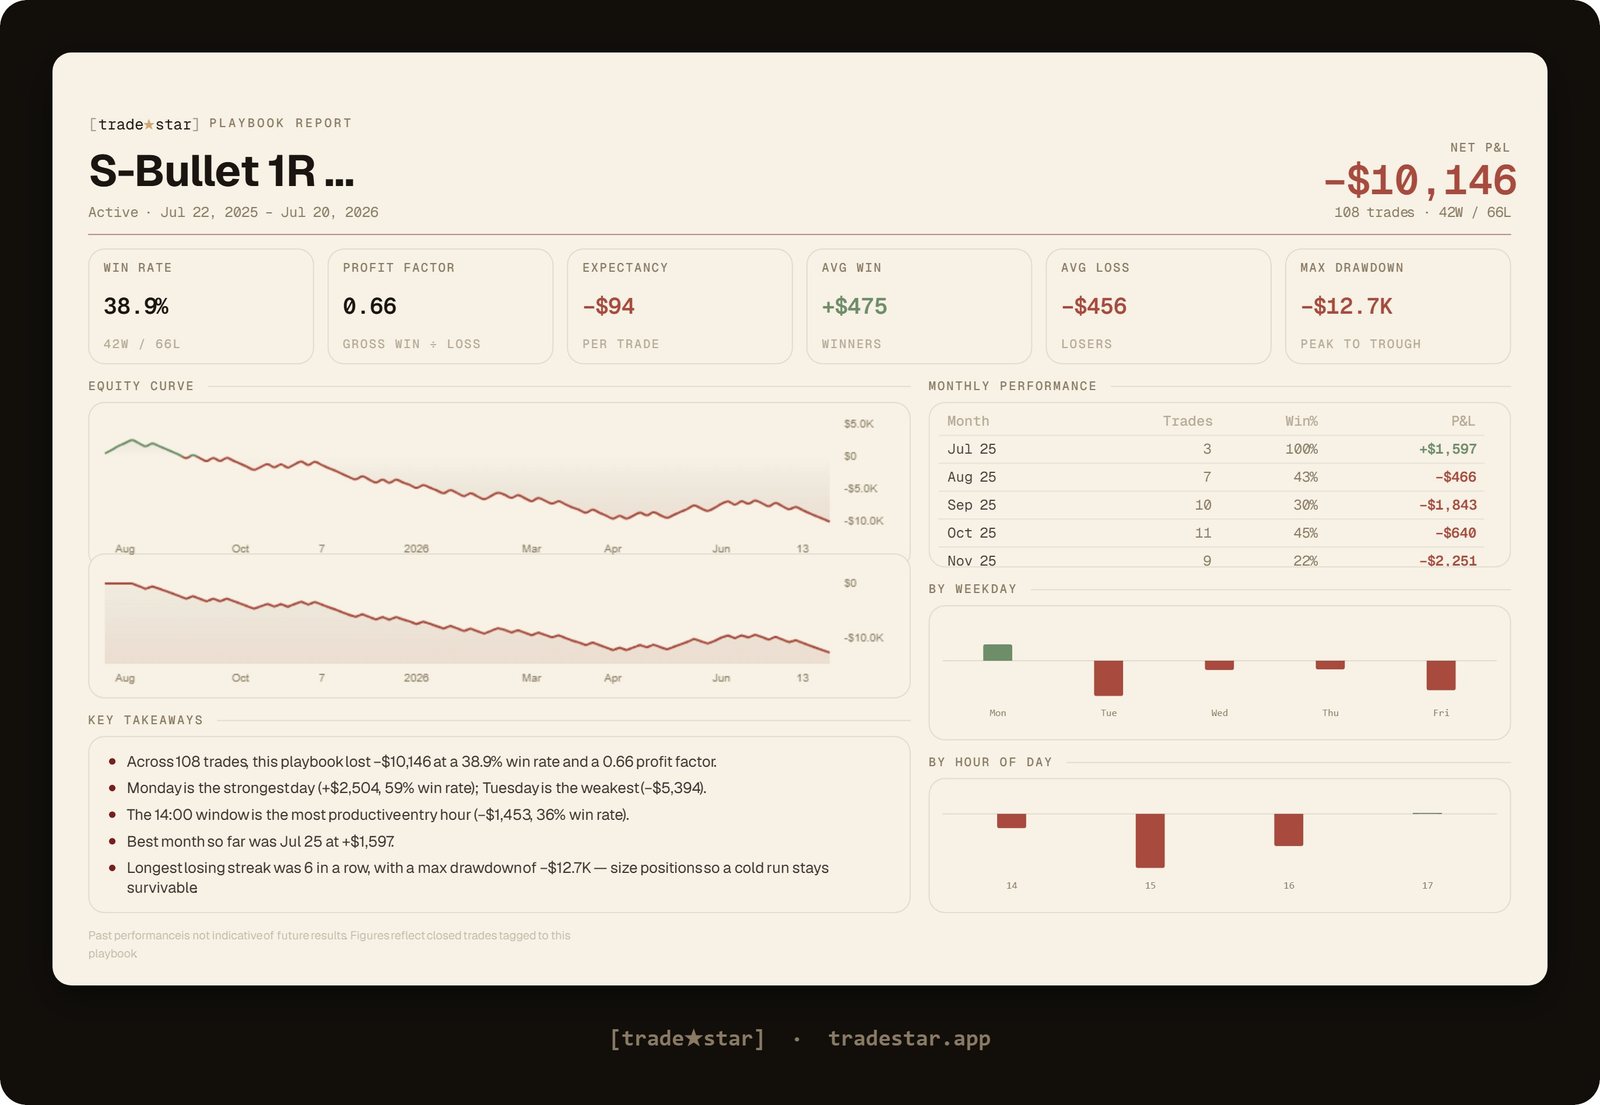
Fixed 1R, AM window. 108 trades, 38.9% win rate, profit factor 0.66, net loss of $10,146.
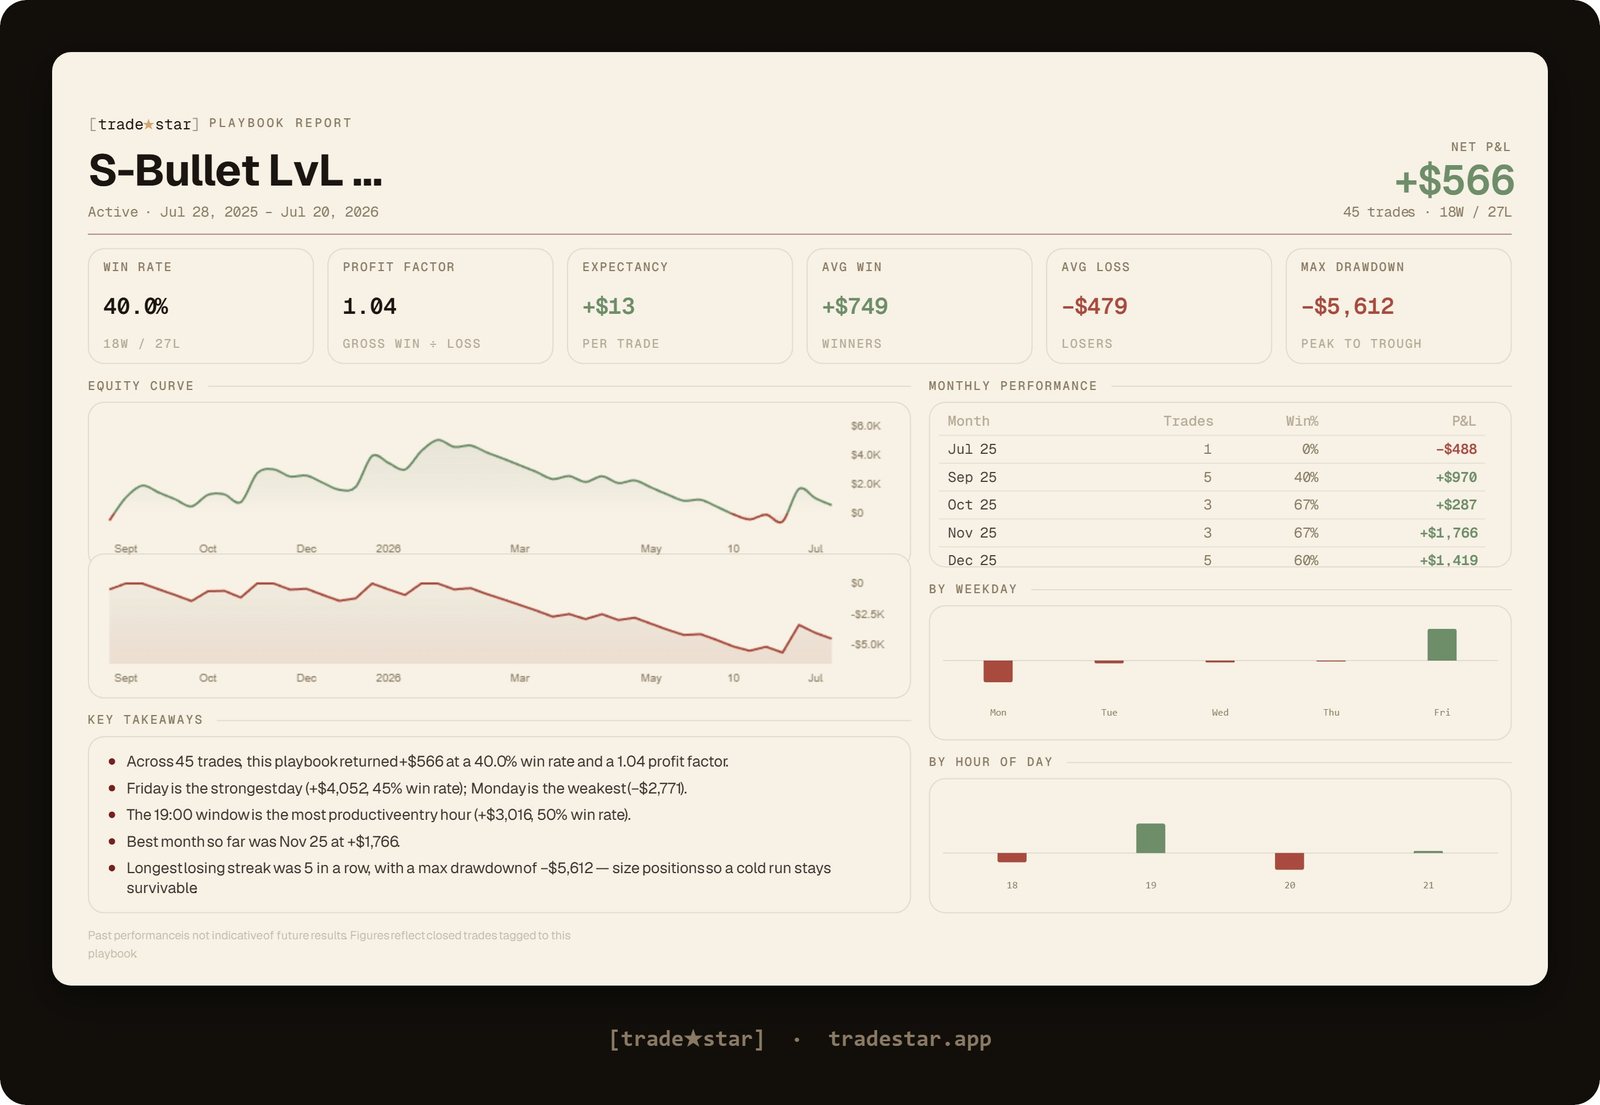
Nearest level, PM window. 45 trades, 40.0% win rate, profit factor 1.04, net profit of $566.
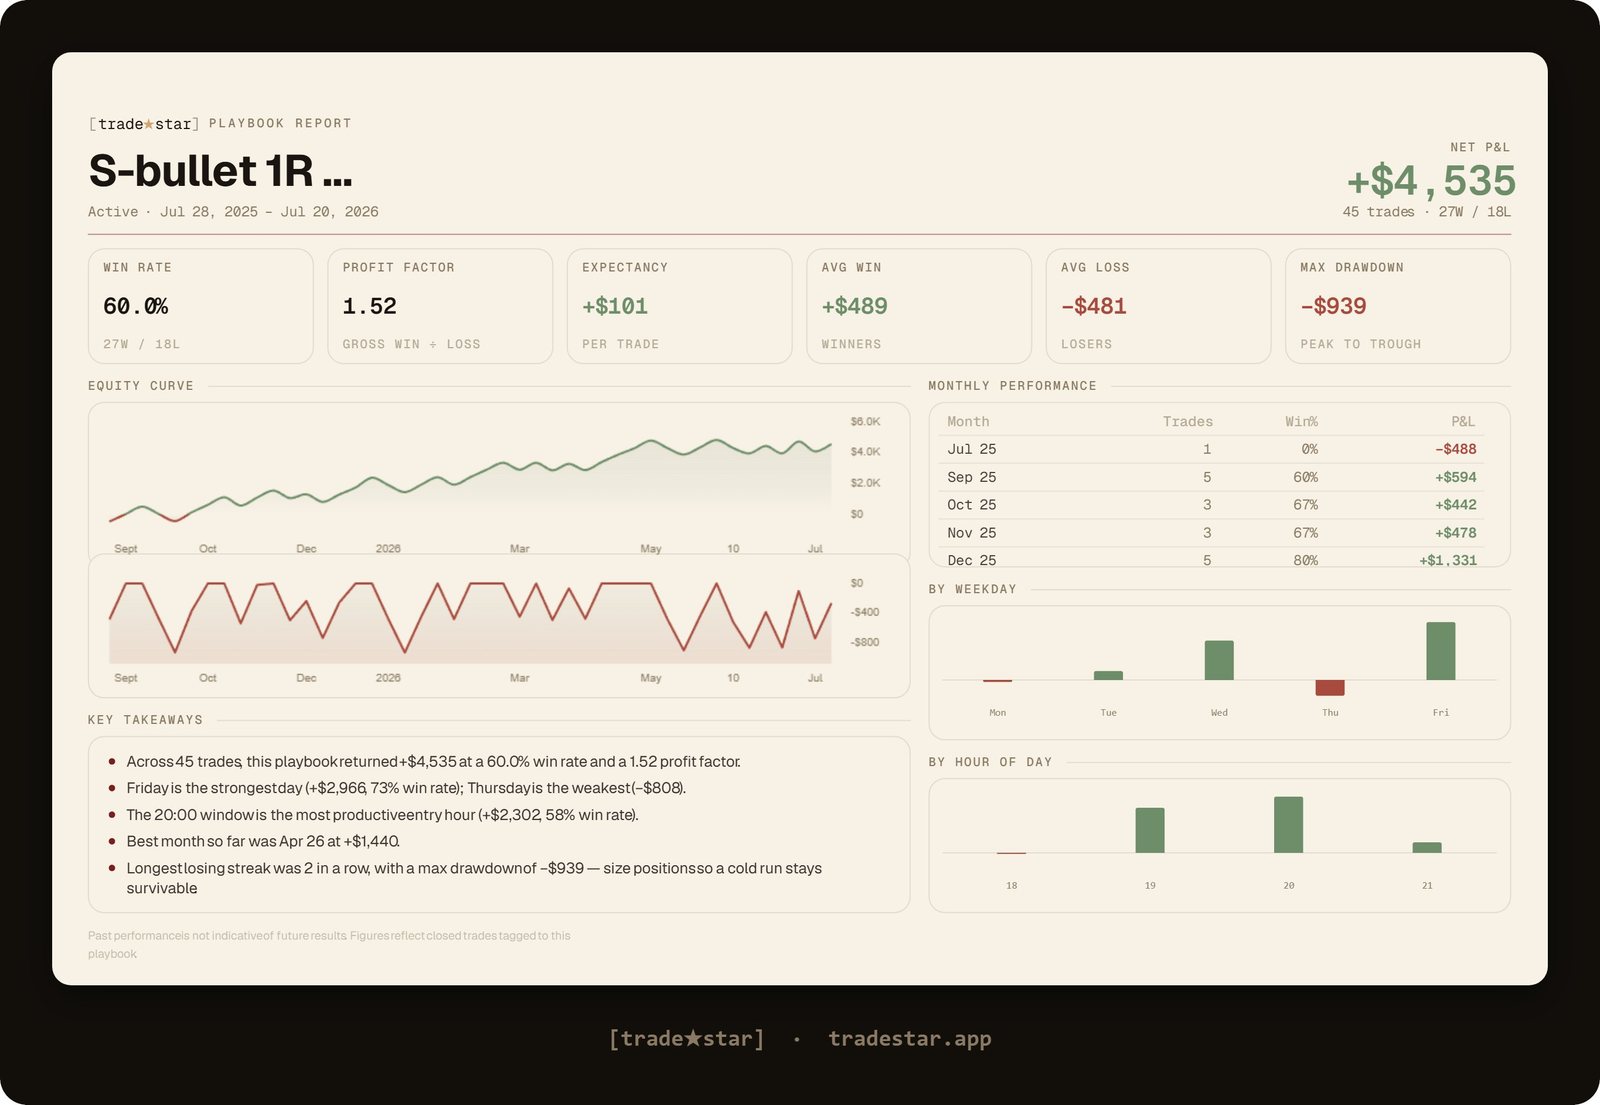
Fixed 1R, PM window. 45 trades, 60.0% win rate, profit factor 1.52, net profit of $4,535.
And for those wondering about 1R: what about 2R? I ran this too, on the best session, otherwise identical settings. Profit factor was 1.04, win rate 34.1%, and a net profit of around $580.
The paradox that explains everything
Here is the part worth the price of the article. The AM window has the strongest raw phenomenon, 77% reversal against PM's 73%, and the worst trade result.
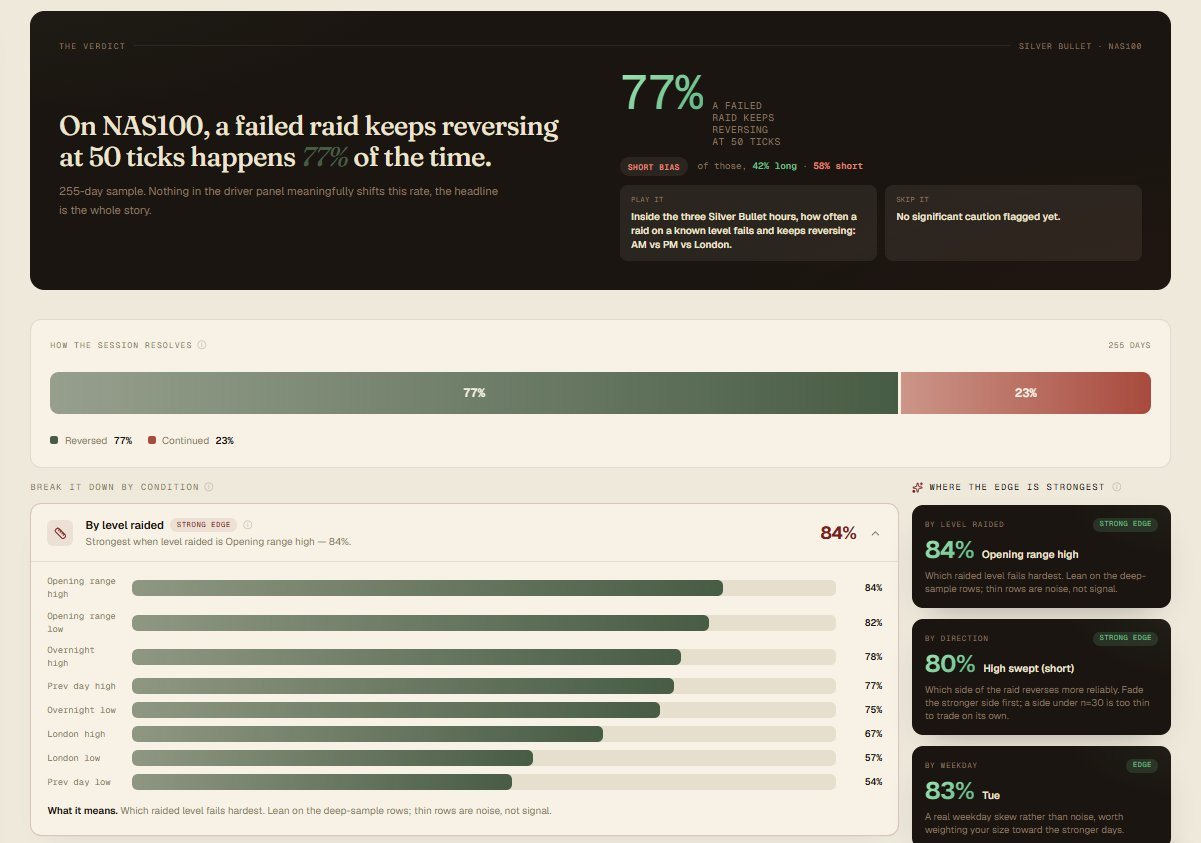
Market Edge, Silver Bullet AM report. 77% of failed raids keep reversing at 50 ticks, across a 255-day sample.
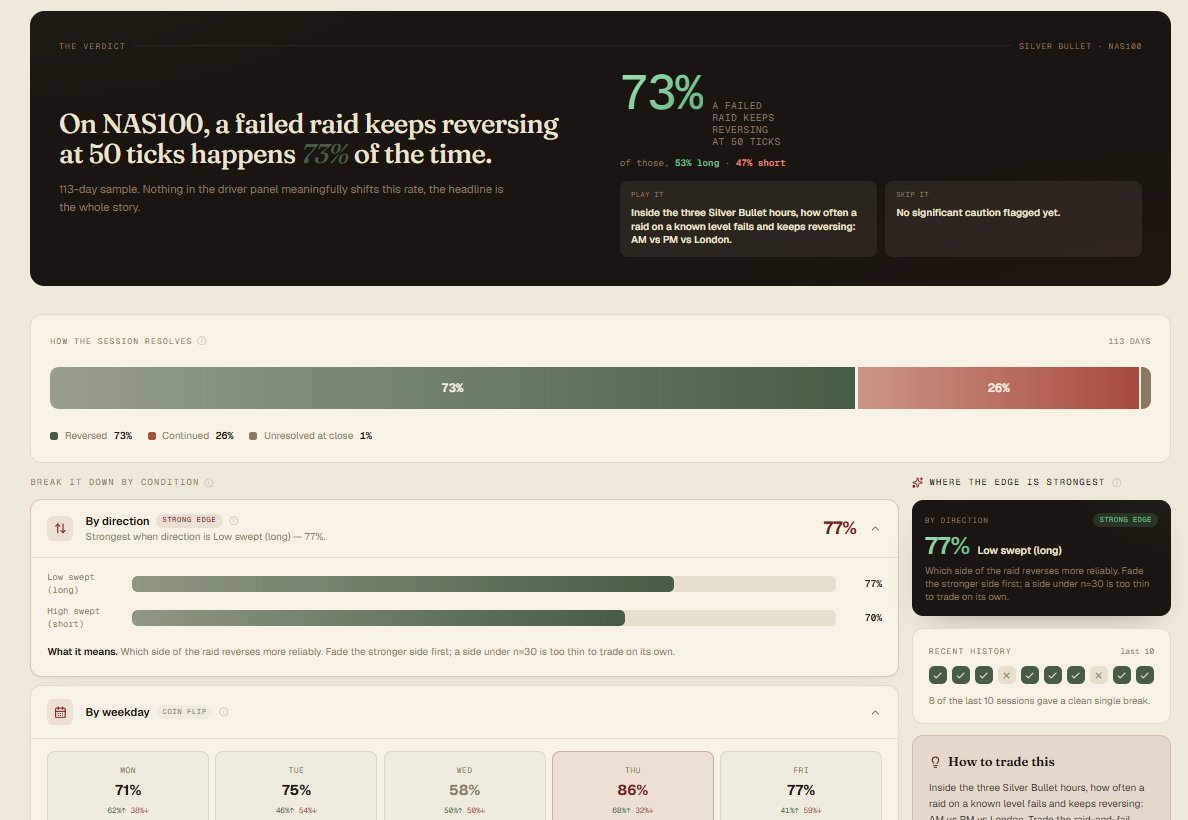
Market Edge, Silver Bullet PM report. 73% at 50 ticks, across a 113-day sample.
The place where failed raids reverse most reliably is the place where trading them loses money.
The resolution is in the reach numbers. The reversal reliably carries 50 ticks. It holds at 25, decays by 100.
Meanwhile the Silver Bullet trade structure, entering the FVG with a stop beyond the sweep extreme, needed a median of 160 ticks of travel to pay 1R in the AM window, against a reversal that reliably delivers 50. The market really does punish the raid. It just does not punish it far enough to pay you.
And the PM window's median requirement was tighter, 128 ticks, which is quietly part of why it performs: the same snapback covers more of a smaller ask.
The reversal is a snapback, not a rotation, which is also why targeting the opposing liquidity pool, the setup's own narrative endpoint, was the worst exit I tested. Even in the profitable window it collapsed the result to near zero. The draw-on-liquidity story fails in the data even where the trade works.
So both camps are half right. The phenomenon believers are right that the market reacts to failed raids. The sceptics are right that the famous trade loses. The thing neither camp measures is the gap between how far the reaction goes and how far the trade needs it to go, and that gap is the whole answer.
What I would actually take from all this
If you trade this setup in the AM window at the structure as taught, 12 months of data says you are paying for the privilege.
If the PM result interests you, respect the sample size and watch it. That is what I will be doing. And if there is a tradeable version of this phenomenon anywhere, the data says it lives in the snapback: short reach, quick exit, not the full rotation the narrative promises.
That is a different trade than the one being sold, and if I test it, the rules will be posted before the results, same as this time.
The deeper lesson is the one I keep finding: the same mechanical setup produced a losing trade at 10am and a promising one at 2pm. Same rules, four hours apart, opposite result.
Almost nothing in trading content acknowledges that edges are conditional on when, and it is exactly the problem I built Market Edge to answer.
The full Silver Bullet report, every window, every level, every weekday, updated as sessions close, is live in Market Edge now, and the indicator that draws this exact tested definition on your chart is included with Pro alongside it.
The rules are free, they are all above. Whether the setup is working right now is the product.
A base rate is a fact, not a signal. These numbers are historical, the samples are what they are, and a strong rate is not a promise. Trade your own plan.
The tested definition is available as a TradingView indicator, and the live report lives in Market Edge.
Every base rate in this piece lives in the Hit Rates library, free to read. Or connect your broker and see which of them your own trading actually survives.