I Tested The ORB Everyone's Arguing About. Here's What The Data Actually Says.
 丂卩ㄖㄖҜㄚResearch notes
The opening range breakout is having a moment.
Scroll trading X for five minutes and someone's telling you the 30-minute ORB changed their life, someone else swears by the retest, and a third account is posting a single 10R screenshot from a strategy they've never shown the losers for.
So I stopped reading threads and ran the tests myself. Same instrument, same year, same rules, changed one thing at a time, and let the data settle it instead of the loudest voice.
Two configs matter, so those are the two I put head to head: the classic breakout (first candle closes beyond the opening range, you go with it) and the break-and-retest (wait for the break, wait for price to come back and hold the level, then enter).
The second is the version @ThiccTeddy has been teaching, and I'll say up front: the data backs him. More on that below, credit where it's due.
First, the disclaimer, because it matters. I don't know ThiccTeddy. We've never spoken. I've pieced together his approach from what's public, and there's every chance I've got a detail wrong or missed a part of it entirely.
So what I've tested is my interpretation of the rules as I understand them, not his exact method. Read the results in that light: they tell you whether this style of setup holds up, not whether I've perfectly reproduced his edge.
First, where this actually comes from
Quick history, because the people arguing about 15 versus 30 minutes mostly don't know it. The opening range breakout isn't a TikTok setup. It traces back to Toby Crabel's work in the late 80s and the pattern research of Larry Connors and Linda Raschke.
Crabel's original wasn't even a fixed clock, it was a short opening range with a volatility-based buffer. So the "classic" everyone cites is really a retail convention layered on decades-old, serious work.
Knowing that matters, because it means the edge, if it's real, has a lineage and a reason, not just a good six months.
The head-to-head
I ran both configs over a full year on the same futures, imported the trade-by-trade results into TradeStar, and read the playbook report on each. Here's what came back.
Classic breakout: it works, barely. 53.9% win rate, profit factor 1.08 (ES) to 1.15 (NQ) depending on instrument, positive but thin. That's a marginal edge.
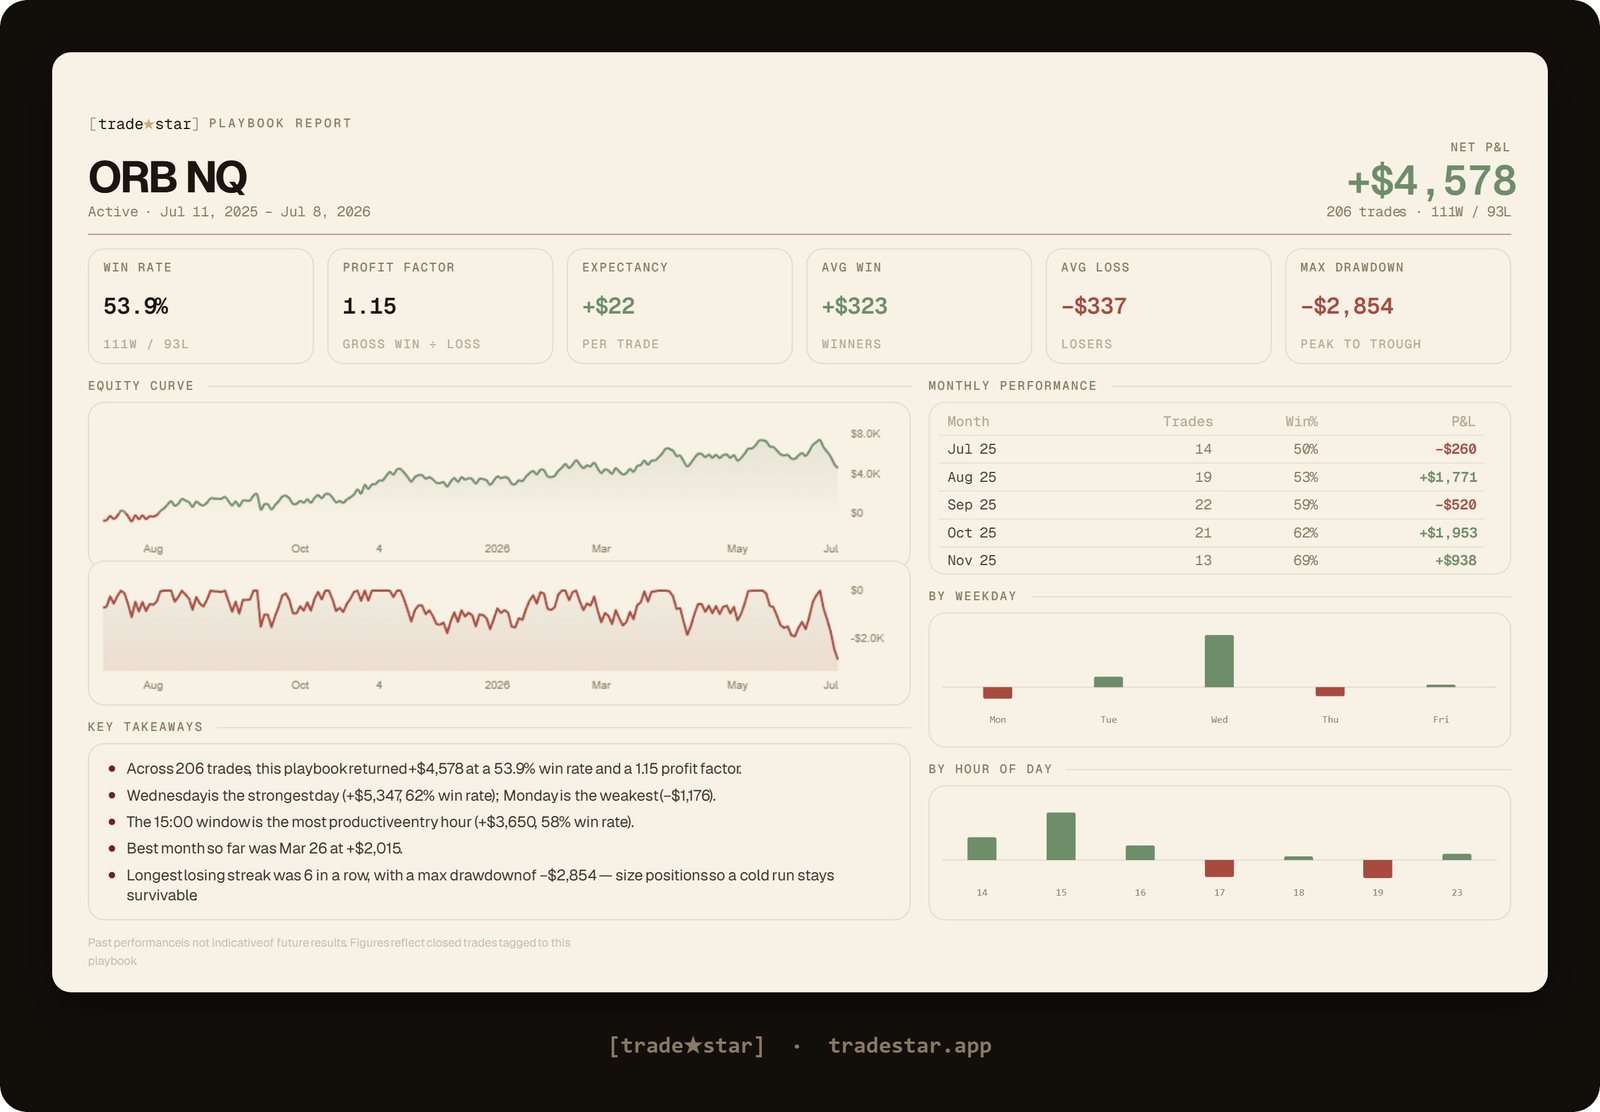
Classic breakout, NQ: a 1.15 profit factor and +$4,578. Positive, but thin.
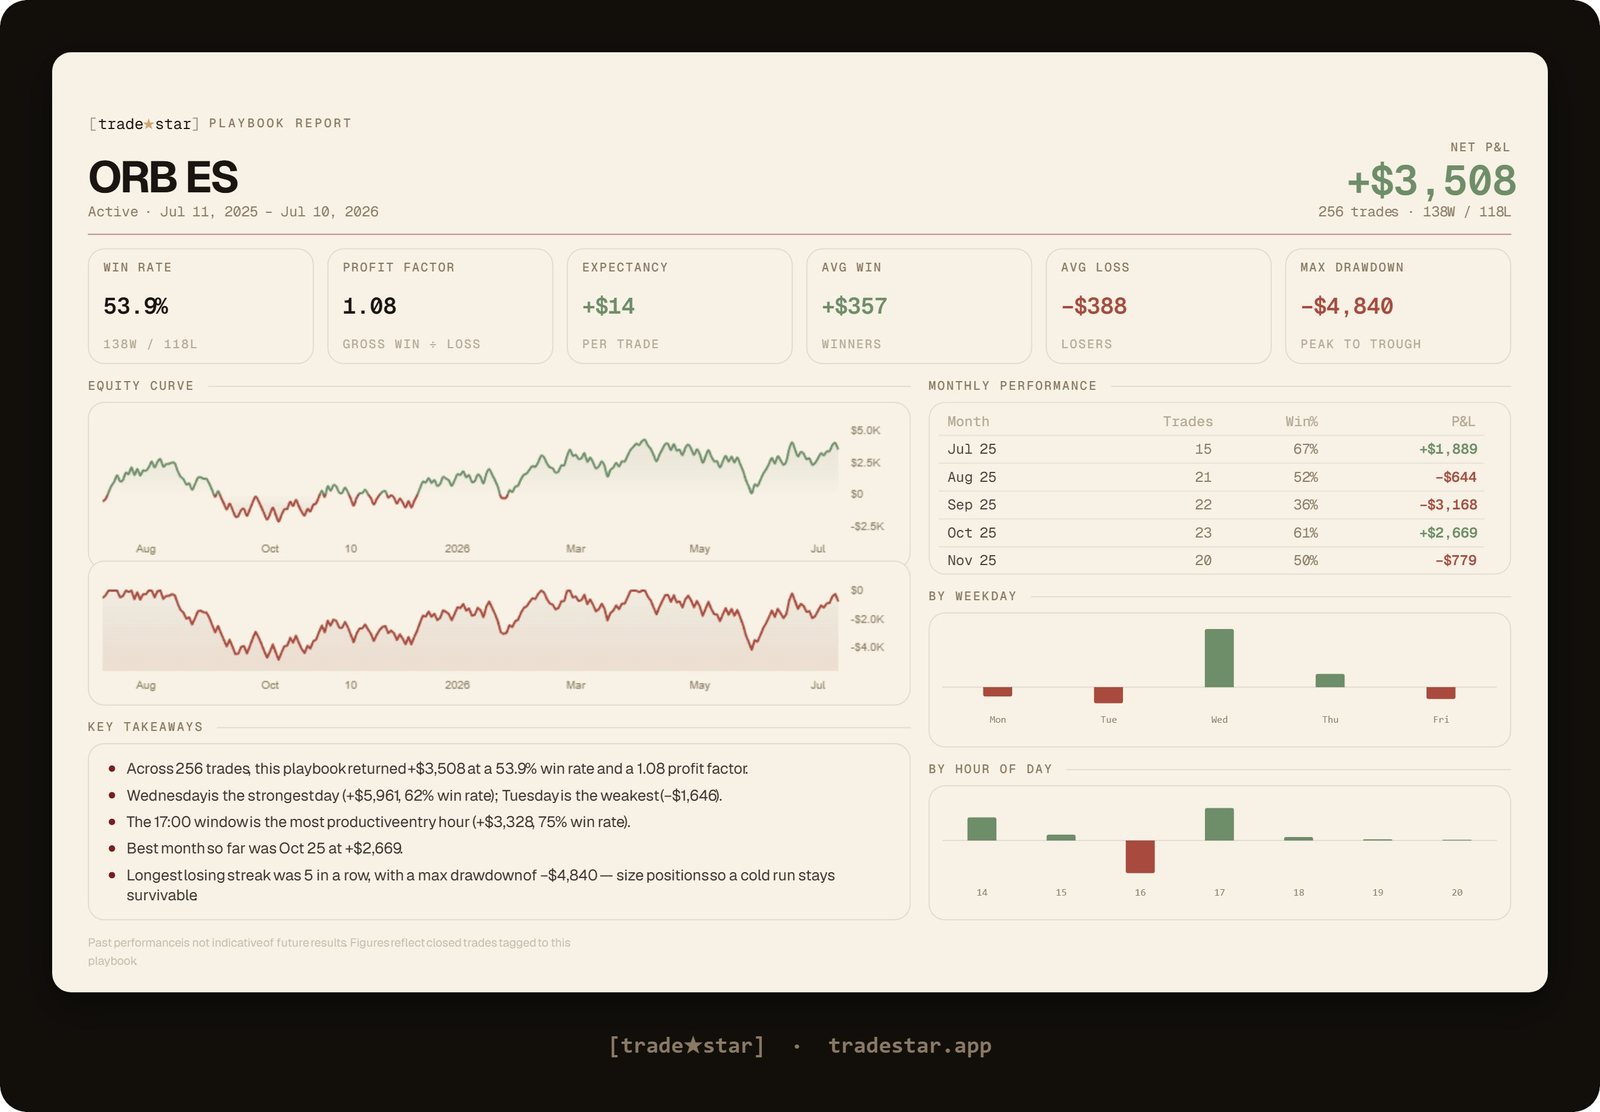
Classic breakout, ES: a 1.08 profit factor. A marginal edge on both instruments.
Traded naked, one bad regime and you're underwater. Anyone selling classic ORB as a slam dunk hasn't looked at the data.
Break-and-retest: a different animal. Fewer trades, higher quality, and every metric that matters improves, higher profit factor, bigger net, and a lower drawdown.
On NQ specifically it was the standout: 58.2% win rate, 1.52 profit factor, +$14,038 over 196 trades, with the max drawdown actually dropping to $2,718.
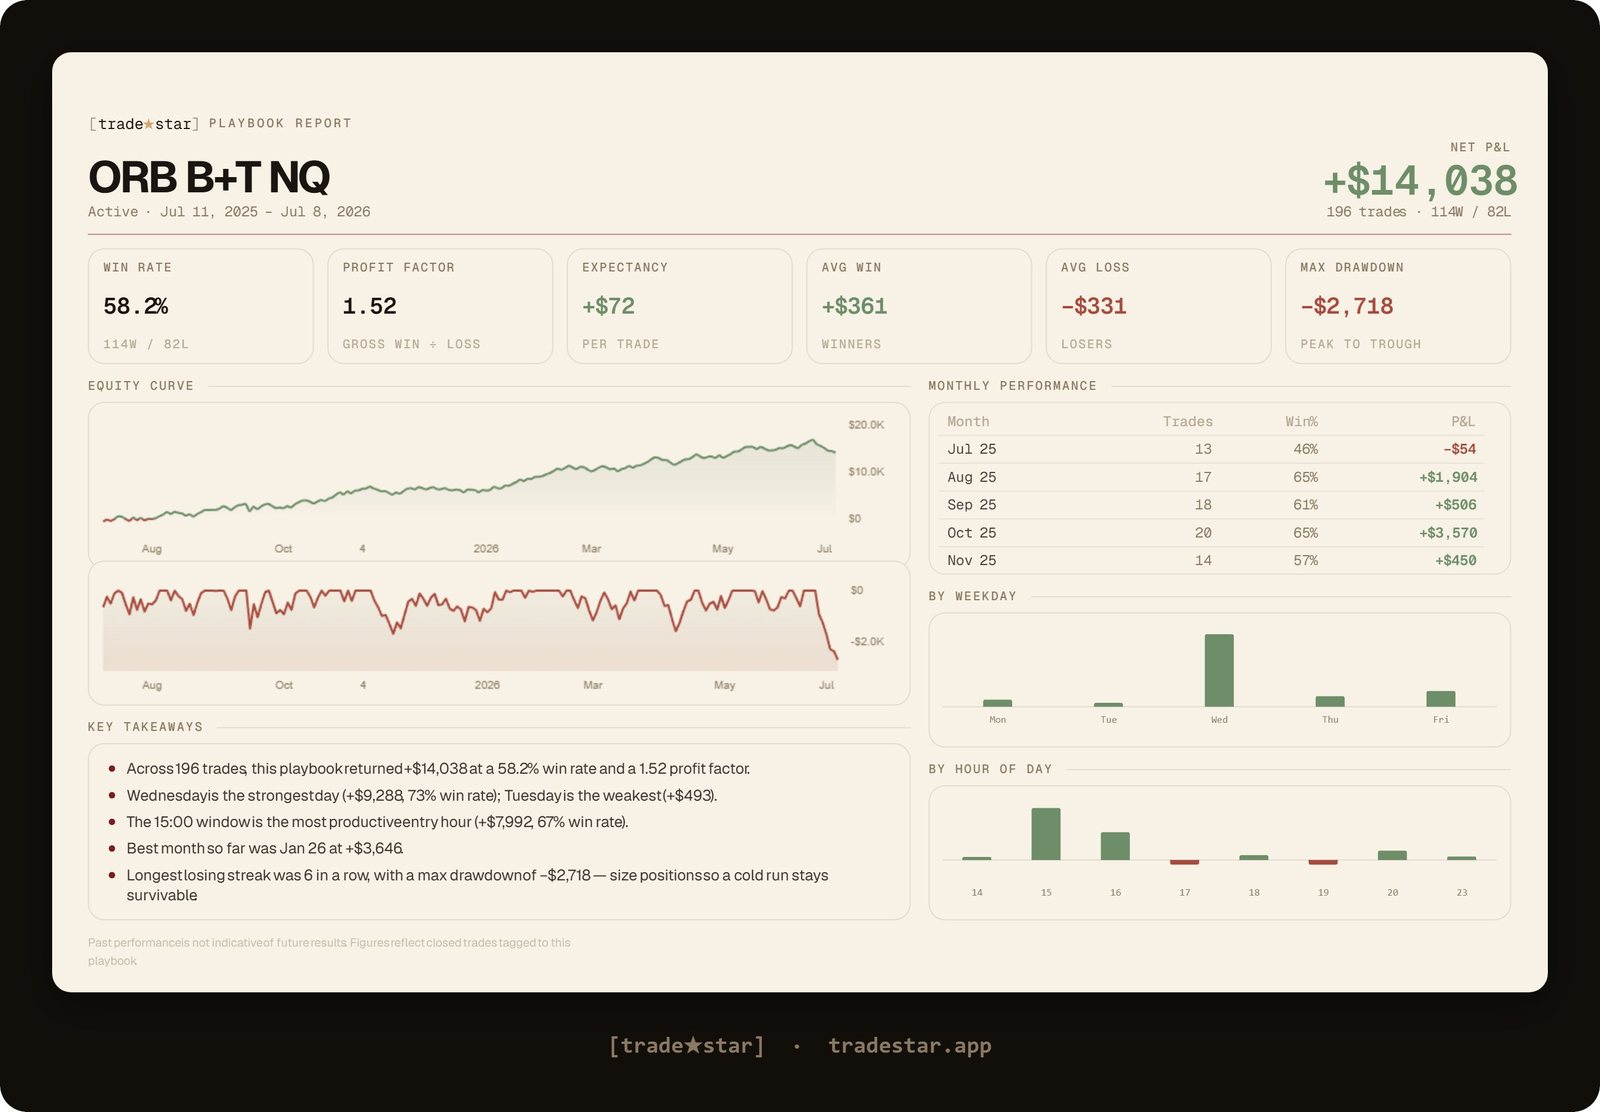
Break-and-retest, NQ: 58.2% win rate, 1.52 profit factor, +$14,038, and a smaller drawdown than the classic.
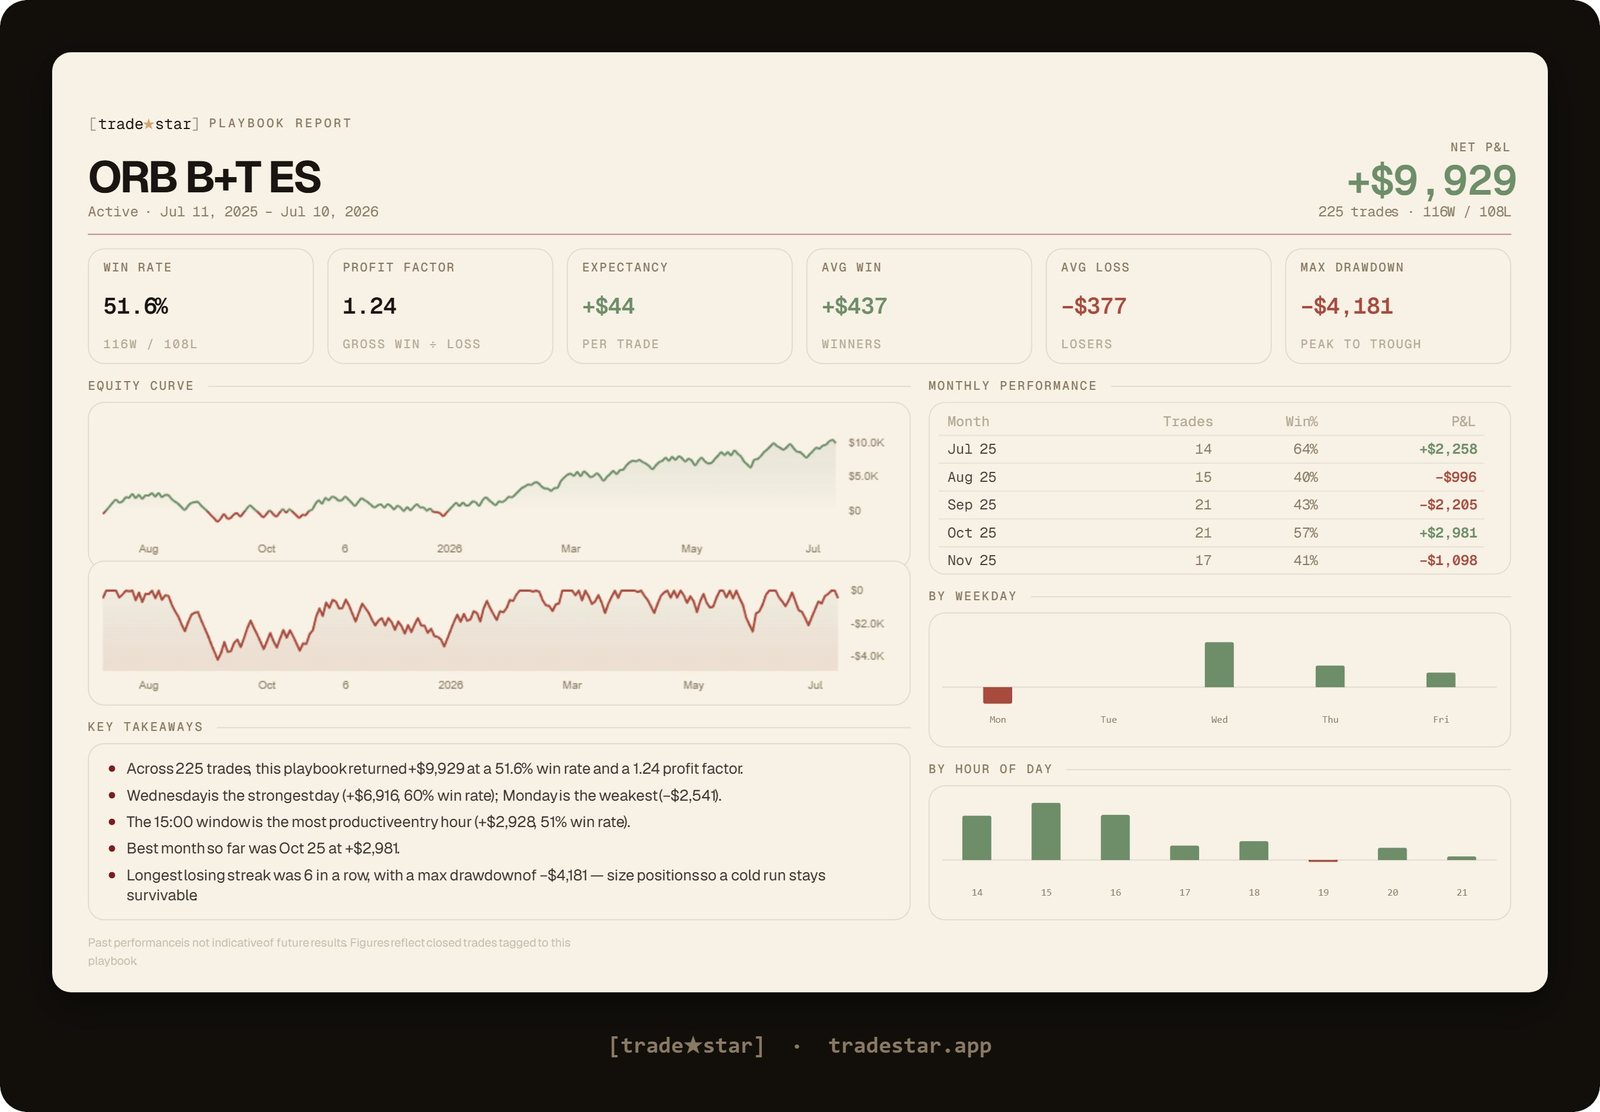
Break-and-retest, ES: 1.24 profit factor and +$9,929. The retest lifts both instruments.
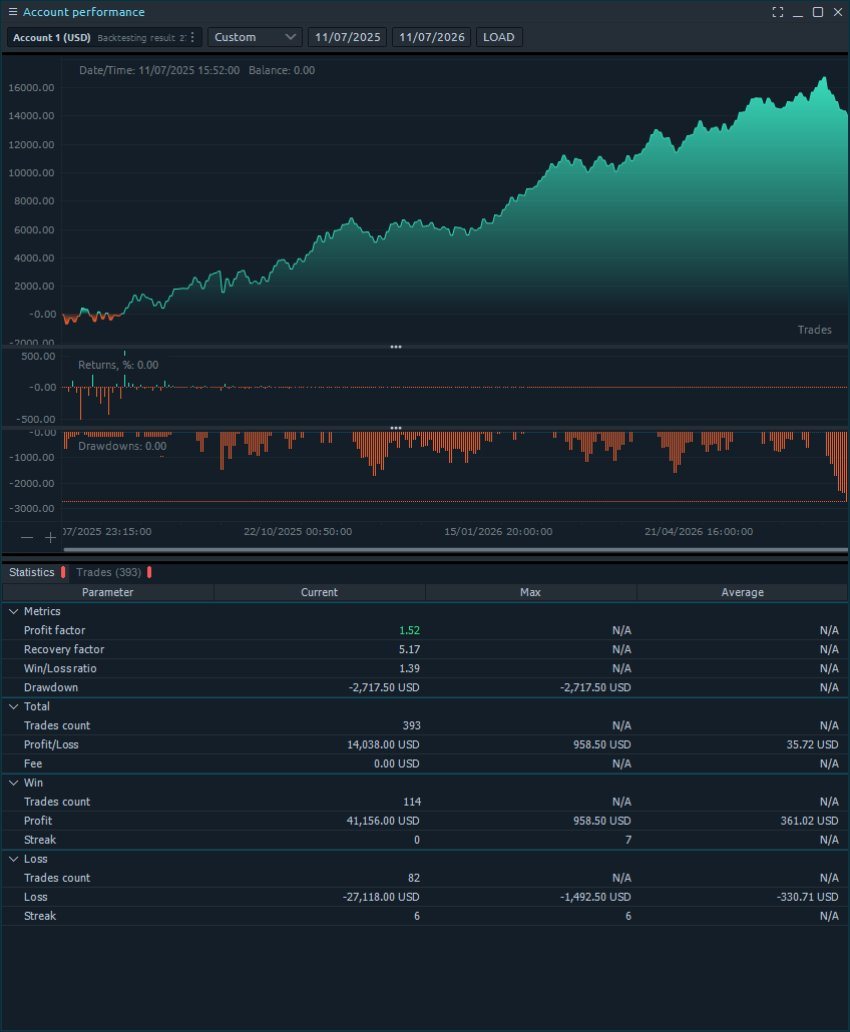
The same NQ config in Quantower: 1.52 profit factor, +$14,038, max drawdown of $2,718. Better return and a smoother ride at once.
Better return and a smoother ride at the same time. That's the combination you want, and it's rare.
So the first honest finding: the retest isn't hype. It measurably beats the naked breakout, and it does it while taking less pain to get there.
I genuinely believe @ThiccTeddy is onto something real. Give him a follow, the man's teaching a setup that holds up.
Why it works, which is the part nobody shows you
Here's where I stopped guessing and pulled the actual base rates for the opening range in Market Edge. A backtest tells you that something worked. It doesn't tell you why, and an edge you can't explain is an edge you can't trust when the market changes. So I went looking for the mechanism.
The data handed it straight over.
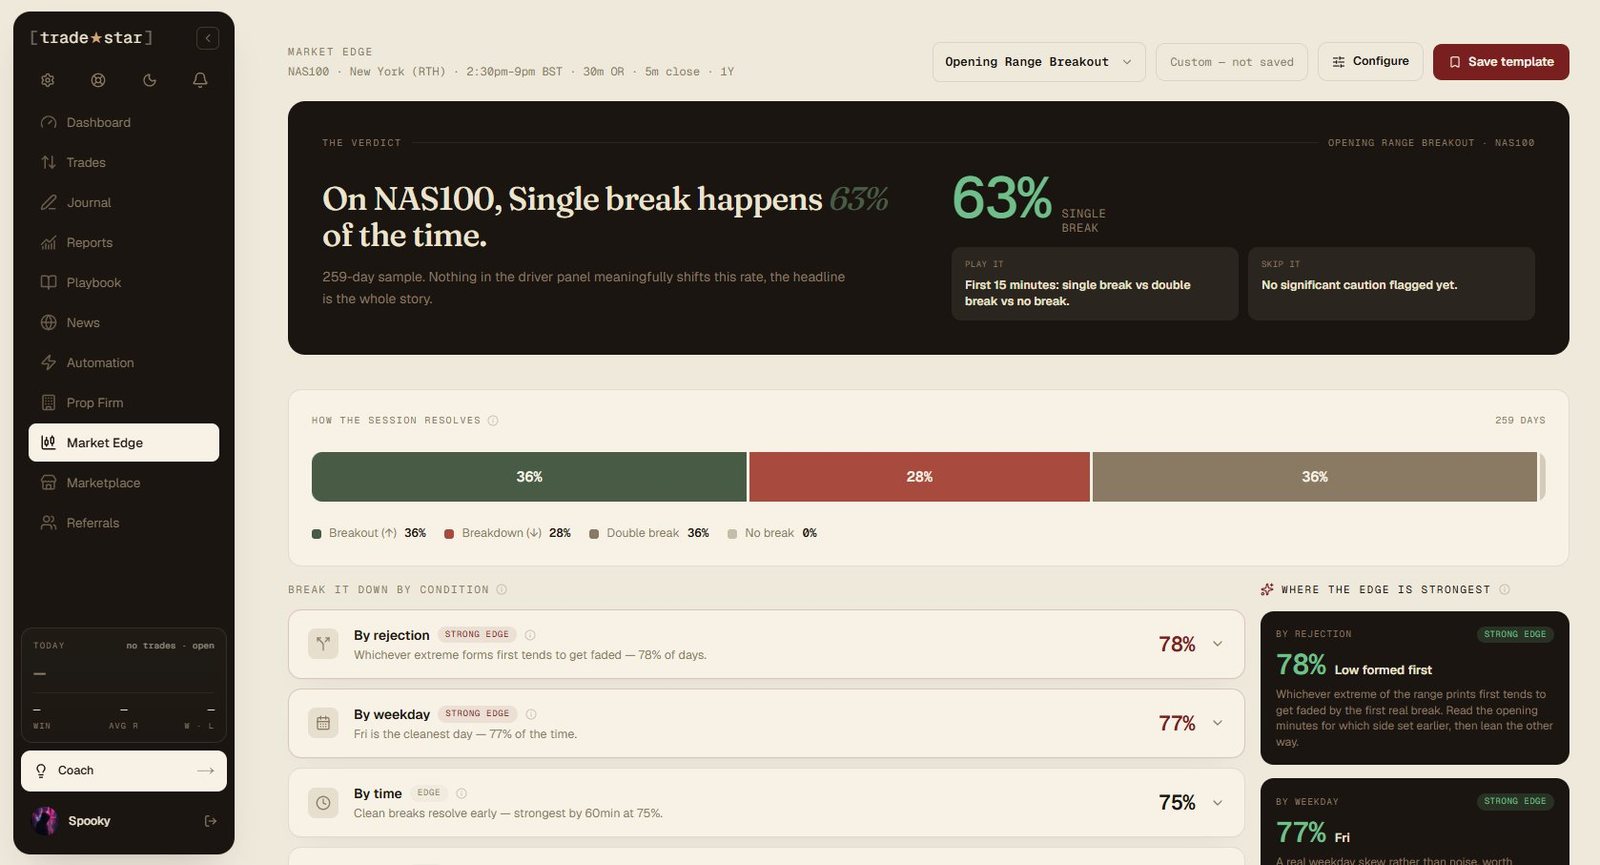
Market Edge: the opening range base rates on NAS100, across a 259-day sample.
The range rejects the side it prints first. Market Edge showed that when the low forms before the high, the high breaks first about 78% of the time, and vice versa around 68% of the time.
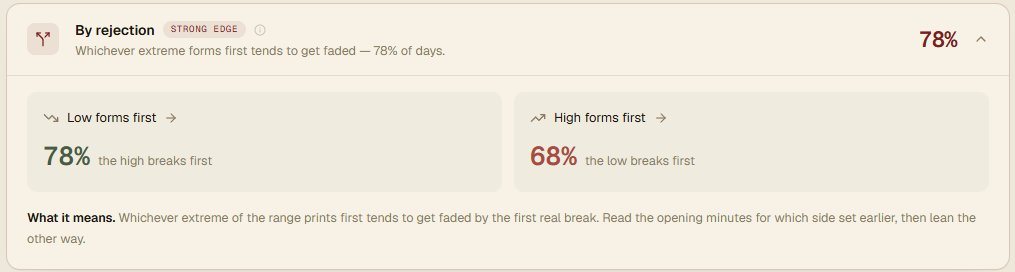
Whichever extreme prints first tends to get faded by the first real break.
That is exactly why the retest beats the raw breakout: the first push is often the fake-out, and waiting for the retest filters out the moves that were about to reverse. The retest isn't a trick, it's catching a real, measurable tendency of the auction.
Clean breaks come early. 75% of clean single breaks happen before 10:30. After that, you're mostly trading chop.
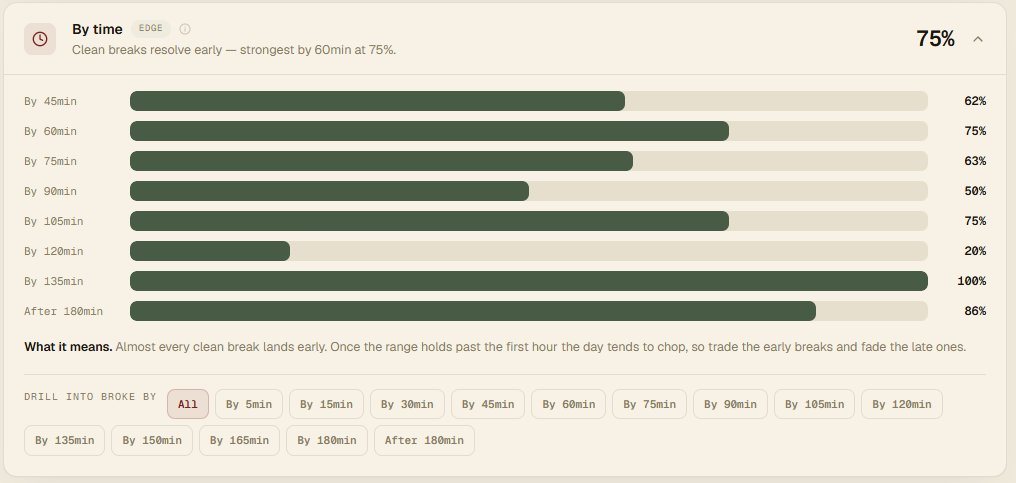
Almost every clean break lands early. Once the range holds past the first hour, the day tends to chop.
Wide ranges commit, tight ranges whipsaw. Break rates climb from 46% on the tightest opening ranges to 69% on the widest. A tight range is a coin flip; a wide one means business.
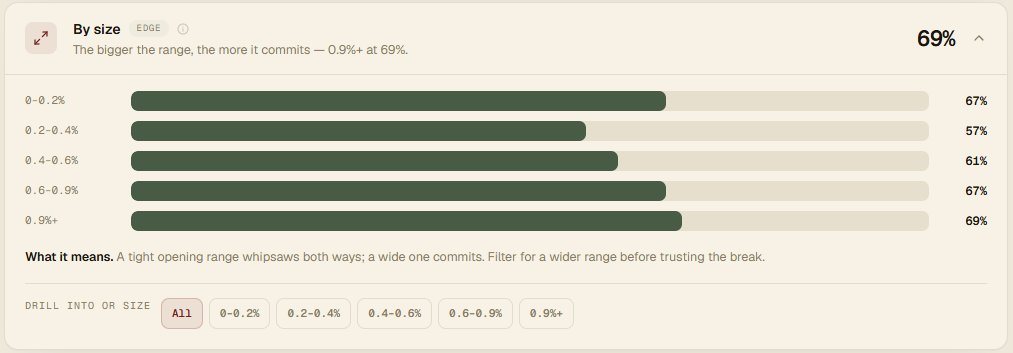
The bigger the opening range, the more it commits. Filter for a wider range before trusting the break.
That's the difference between a backtest and an understood edge. I didn't just find that break-and-retest works. I found why, and the why is a stable feature of how the opening range behaves, not an artifact of one lucky year.
So naturally, I tried to make it even better
This is where most people would show you the highest number and stop. I'm not going to, here's why.
I took the NQ break-and-retest winner and layered on what Market Edge suggested.
Range-size filter (skip the tightest ranges): real, but marginal. Barely moved the needle. Keep it, it costs nothing, but it's not a game-changer.
Drop the weak weekdays: this lifted profit factor from 1.52 to 1.85 and looked fantastic. But it's a different kind of edge from the rest, and worth being honest about the difference. There's no mechanism for why a particular weekday should be structurally worse, it's a statistical observation, not a structural one.
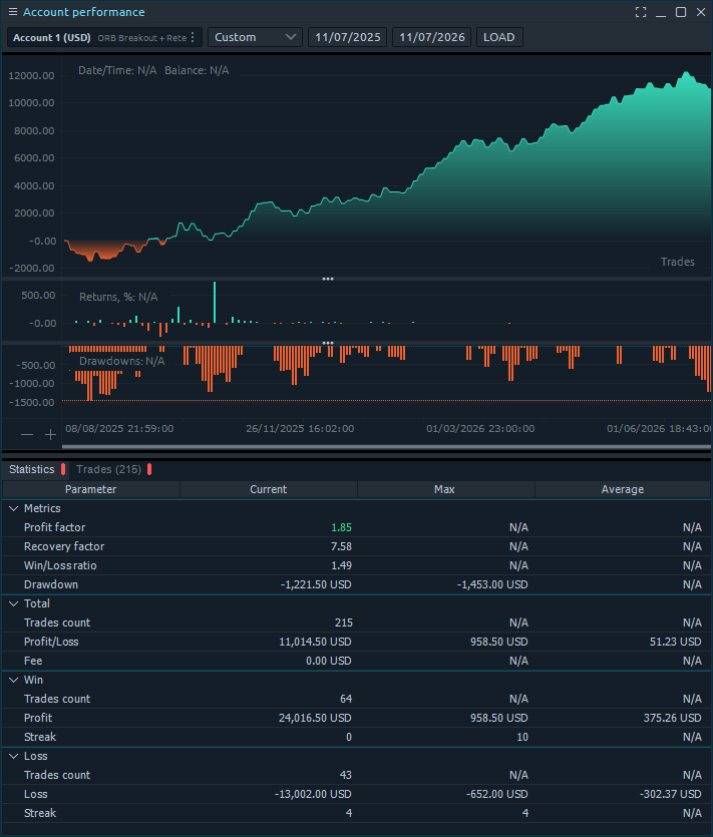
Dropping the weak weekdays lifts the profit factor to 1.85. It looks fantastic, and that is exactly the problem.
That doesn't make it useless, but it does make it fragile: a structural edge (like the retest catching first-side rejection) has a reason to persist; a weekday filter only has this year's data.
So I treat it as a conditional filter, tradable if you accept that it may not hold, and that you're leaning on a pattern that could fade without warning. It's the kind of edge you run with a lighter hand and keep checking, not one you build the whole system around.
I actually use a weekday filter on another one of my systems for exactly this reason, it adds real return, and I run it knowing full well it's a statistical lean, not a structural law. Eyes open. That's the whole distinction: structural edges you trust, statistical ones you rent.
It's also the textbook signature of overfitting: a big improvement with no reason behind it. So I'm flagging it as interesting, probably not durable, not featuring it as a win. If you can't explain why a filter works, assume it won't next year.
Switch to the 0.5x range target: this is the sharpest lesson. It pushed profit factor to 1.95, the best number in the whole study. It also lowered total profit from $14k to $9k.
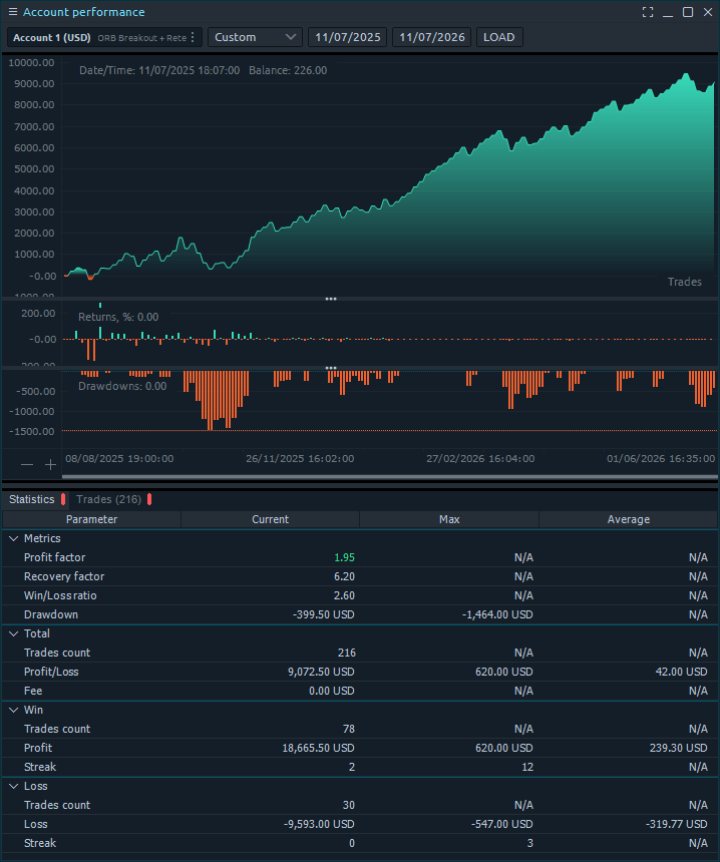
The 0.5x target posts the best profit factor in the study, 1.95, while making less money. Profit factor is not the goal.
Read that again. The "best" profit factor made less money, because I'd optimised the ratio by cutting the payout. Profit factor is not the goal. Dollars are. So I left this one on the shelf.
Here's the takeaway, and it's the honest core of the whole piece: Market Edge didn't hand me a magic setting. It did something more useful. It told me why the edge works, and it showed me which "improvements" were real and which were me fooling myself with a prettier backtest.
The genuine keeper was understanding the mechanism, which made me trust the core edge more. The flashy optimisations were mostly noise dressed as insight, and the tool is what let me tell the difference.
What I'd actually run
Not the 1.95 profit factor. Not the day-of-week filter. The honest recommendation is the robust core: break-and-retest on MNQ, a sensible target that keeps the dollars, the range filter if you want it, and skip the overfit tweaks.
That's roughly the 1.52 profit factor, $14k config, the one with a reason behind every part of it. Less impressive on a screenshot, more likely to still be there next year.
That's the difference between optimising and overfitting, and it's the difference between a tool that sells you a dream and one that tells you the truth.
The point
Market Edge isn't a signal service and it won't take the trade for you. What it does is turn a setup, yours or one you found on X, into something you actually understand: is the edge real, why does it work, which conditions make it stronger, and which "improvements" are traps.
It runs on cold data, not stories. You can use it to find an edge or to validate the one you already trade, which is the more valuable job, because most traders run their setup on faith and never once check whether the market agrees.
I checked. The break-and-retest holds up, and now I know why.
If you want to run your own setups through the same process, the base rates, the backtesting, and the playbook reports are all in TradeStar. The ORB indicator is live in Pro now, along with the guide on how to actually trade it, and the automation kit is coming soon.
Every base rate in this piece lives in the Hit Rates library, free to read. Or connect your broker and see which of them your own trading actually survives.