My Exact 5-Step Method for Finding Edges
 丂卩ㄖㄖҜㄚResearch notes
Most traders find an edge on a chart. They spot something that looks like a pattern, feel the click of recognition, and marry it on the spot. Then they spend the next six months explaining away every trade where it failed.
I do the opposite. Every edge is guilty until the data clears it. What follows is the exact loop I run on every idea, start to finish, using the tools I built into TradeStar and a backtest in Quantower.
By the time I put real size on something, it has already survived a process designed to kill it. That is the whole difference between a system and a story.
Step 1: I start in the data, not on the chart
I don't hunt for edges by staring at candles. I hunt in historical base rates, using Market Edge.
Market Edge
Market Edge is a library of data by session, across Gold, Nasdaq, S&P, Dow and the Russell. Every card is a question the market has already answered thousands of times. How often does the gap fill. How often does the initial balance break just once. How often does direction hold through power hour.
Each read comes with its raw sample size, so I always know whether I'm looking at a real tendency or a coin flip with a story attached.
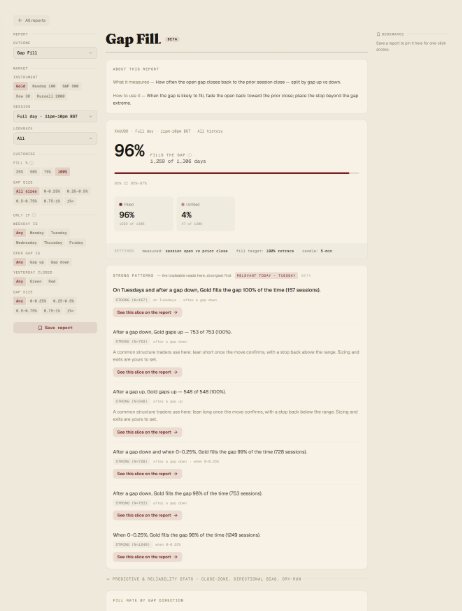
Take the one that jumps off the screen. On Gold, the opening gap fills back to the prior session close 96% of the time. Not on a handful of cherry-picked days, on 1,259 of 1,306 sessions across all history, with a 95% confidence interval of 95 to 97%.
Then I drill in, because the average hides the edge. Split by direction, a gap down fills 98% of the time and a gap up fills 94%. Filter to small gaps of a quarter of a percent or less and the fill rate holds at 98% across more than 1,200 sessions.
Partial Gap Fill Report
On Tuesdays, after a gap down, Gold has filled the gap on all 157 sessions it has ever happened. The tool flags that the weekday effect is statistically significant rather than noise.
That is what I'm looking for. Not a vibe. A pattern with a skew I can write down as a single sentence, backed by a sample size big enough to take seriously.
Step 2: I turn the observation into a claim I can prove wrong
Here is the part almost nobody does, and it's the one that matters most.
A base rate is not an edge. It's a candidate. A gap filling 96% of the time does not mean a gap trade makes money 96% of the time, because knowing the destination tells you nothing about the drawdown you eat on the way there, the entries you miss, or what costs and slippage do to a setup that only pays a small retrace.
High base rate, real edge, and profitable after costs are three different things. Confusing them is exactly how people lose money clutching a statistic.
So I force the observation into a falsifiable hypothesis, something precise enough for the data to destroy. For the gap: fade the open back toward the prior close, stop placed beyond the gap extreme, taken only on the conditions where the base rate is strongest.
Now it's a claim with an entry, an exit, a stop and a condition. If it's real, it survives testing. If it's narrative, it dies. Both outcomes are useful. One hands me an edge. The other saves me from bleeding an account into a number I wanted to believe.
Step 3: I take it to Quantower and try to break it
Now it goes to the courtroom.
I build the setup in Quantower and run it across the full history. Real entries, real exits, real stops, costs included. No optimising until a random result looks like genius, no quietly dropping the trades that spoil the picture.
The base rate told me the market has a tendency. The backtest tells me whether I can actually capture it once the messy business of getting in and out is accounted for.
If the initial data looks good, it earns the next step. If it doesn't, it's dead, and I've lost an afternoon instead of a funded account. That trade is worth making every single time.
Example backtest in Quantower
Step 4: I close the loop back in TradeStar
Here is the part that ties it together.
When a backtest survives Quantower, I export the results and import them into a fresh account in TradeStar. Then I tag every trade to a playbook.
Now the exact same engine that grades my live trading grades the backtest, on identical terms, with no special pleading for the setups I happen to like.
Step 5: I read the verdict
Then I open the playbook report and let it tell me the truth.
The playbook report
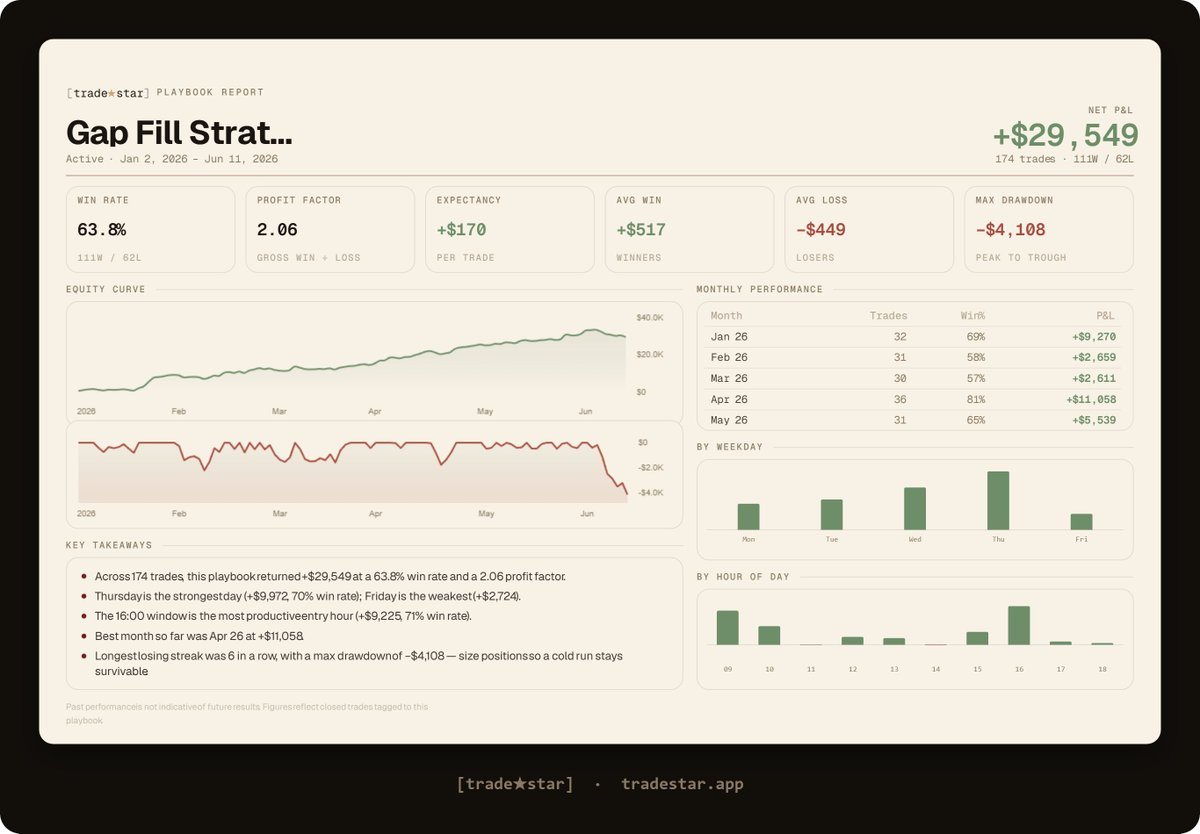
This is where an idea becomes a decision. Net P&L, win rate, profit factor, expectancy per trade, and worst drawdown peak to trough, all in one place, all computed from the trades rather than from my memory of them.
And it breaks the performance down in ways the eye cannot. By month, by weekday, by hour of day. That last one matters more than the headline, because an edge almost never lives evenly across a session. It lives in a window. The report is what tells me which window, so I know where to point the size and where to sit on my hands.
That is the difference between knowing you have an edge and knowing where your edge actually is.
The point
This is the whole game, and it's boring on purpose.
An idea is worthless until it has been through the loop. Market Edge finds the candidate. A falsifiable hypothesis gives the data something to shoot at. Quantower is the judge. The playbook report is the verdict, and the same report grades a backtest and a live account without flinching, so I can never lie to myself about which setups are carrying me and which ones I just like.
I don't trade ideas. I trade the ones that survived being tested. Everything else stays a story, and stories are what other people sell you.
If you want to run your own edges through the same loop, the tools are at tradestar.app.
Every base rate in this piece lives in the Hit Rates library, free to read. Or connect your broker and see which of them your own trading actually survives.