The ICT Fair Value Gap
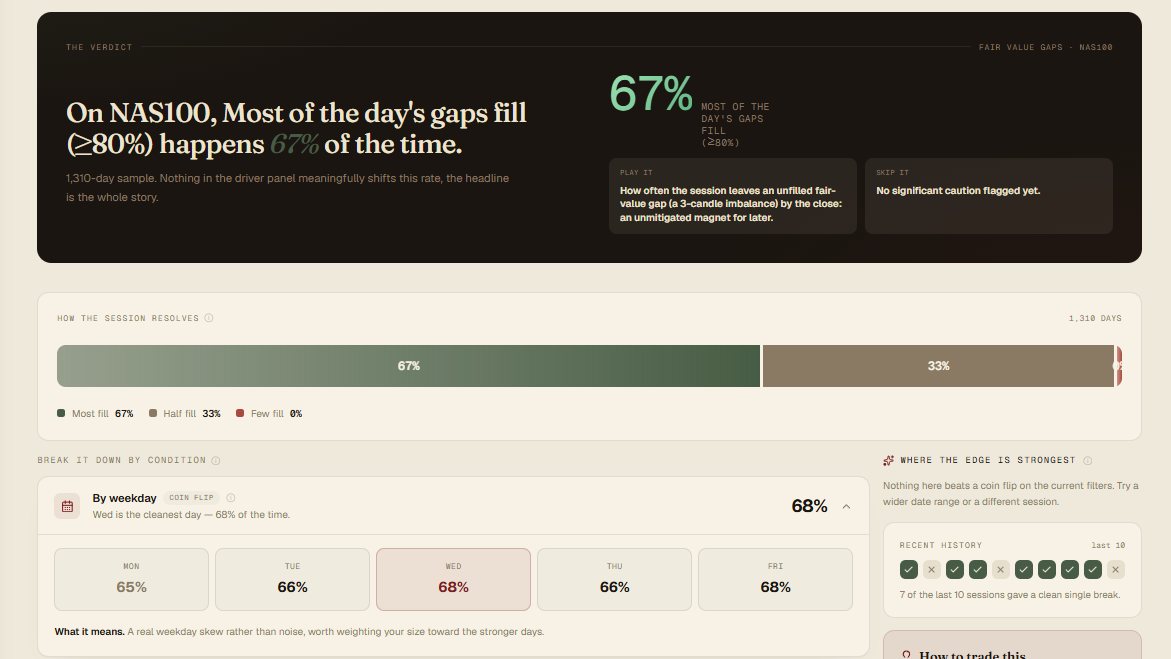
Price does not like leaving money on the table. When a candle moves so hard that the wicks either side of it do not overlap, it leaves a Fair Value Gap, an imbalance the market tends to return and fill. ICT built an entire entry around that return, and on the Nasdaq, where ICT first taught it, most of a day's gaps do get revisited.
A Fair Value Gap is a three-candle imbalance: a middle candle so strong that candle one and candle three do not overlap, leaving an untraded gap between them. In an uptrend a bullish gap acts as support you can buy the return to; in a downtrend a bearish gap is resistance you can sell. The entry is not the gap itself, it is the reaction at it: price retraces into the gap, often to its midpoint, and you enter when lower-timeframe structure shifts in your bias direction, stop beyond the far edge, target the next pool of liquidity. When a gap is instead closed clean through, it flips: an inverted fair-value gap becomes support-turned-resistance, a reversal entry in its own right.
How to trade it
Draw it yourself, or let us draw it for you.
Everything you need is in the 5 steps above. No tool, no login, nothing held back.
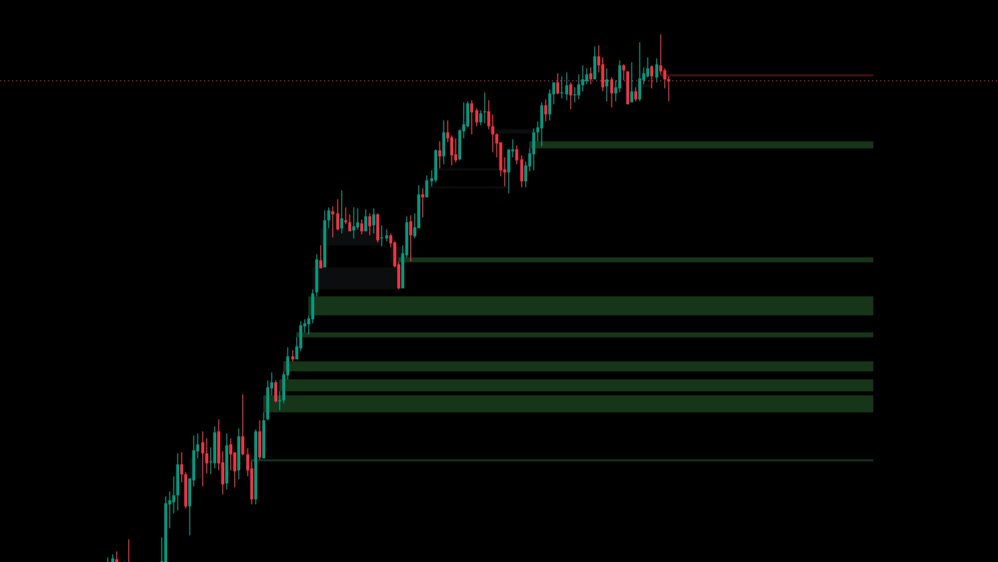
The Fair Value Gap indicator detects the three-candle imbalances, grades each by size against the day's range, and tracks mitigation including average bars-to-fill, so the gaps worth trading are marked and measured rather than eyeballed. It is included with Pro, no extra purchase.
See what you get with ProWhen it fails
Not every gap holds. On a strong trend day price can blow straight through a gap without reacting, which is the tell that the gap has failed and, often, flipped. A gap that closes clean through is no longer support or resistance in its original direction, and buying it again is fighting the move.
A gap can give a clean reaction, pull you in, and fail anyway. That is why the stop sits beyond the gap and the entry waits for structure, not just the touch. Our data measures how often gaps get filled, not how often the entry pays, and those are not the same number.
Related strategies
You know the setup. Here is when it pays.
Market Edge tells you when a setup is worth trading and when it isn’t. Built on five years of real market history, it measures how any setup actually behaved, by day of the week, by time of day, by the state of the market, and shows the conditions where it paid and the ones where it didn’t. Same setup, very different odds depending on when you take it.
66% is the headline. The trade lives underneath it, in the conditions, so you take the version with the edge and skip the one that looks identical but isn’t.