The ICT Judas Swing
Michael Huddleston named it after the betrayal: the first sharp move of the session is the Judas Swing, a false push that runs the stops resting beyond the overnight range before the market turns and trades the other way. It is one of the most-taught setups in the ICT playbook, and on the Nasdaq the raw material for it, a swept overnight range, is there almost every day.
The Judas Swing is a liquidity sweep and reversal. Overnight, the Globex session prints a tight range, and breakout traders leave stops and orders just beyond its high and low. At the London or New York open, price spikes through one side of that range, runs those stops, then fails to hold and reverses. The sweep is the trap; the reversal is the trade. Crucially, the sweep alone is not the signal: you wait for price to fail beyond the level and shift structure back through it before entering, in the direction of your higher-timeframe bias, targeting the opposing liquidity.
How to trade it
Draw it yourself, or let us draw it for you.
Everything you need is in the 5 steps above. No tool, no login, nothing held back.
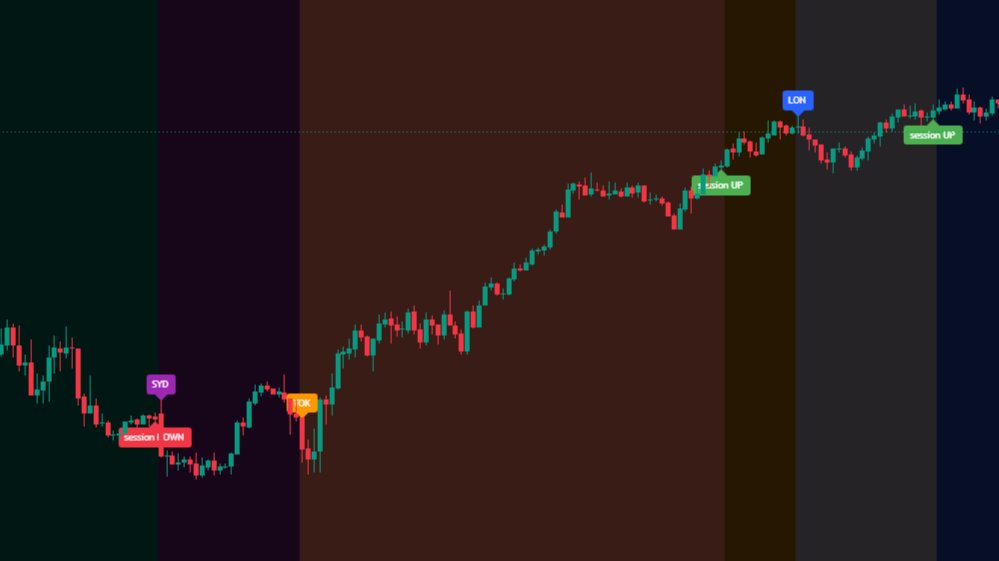
The Market Sessions indicator shades the Globex and killzone windows and plots the overnight high and low, so the liquidity the Judas Swing runs is drawn on your chart before the open and you are watching the right level at the right time. It is included with Pro, no extra purchase.
See what you get with ProWhen it fails
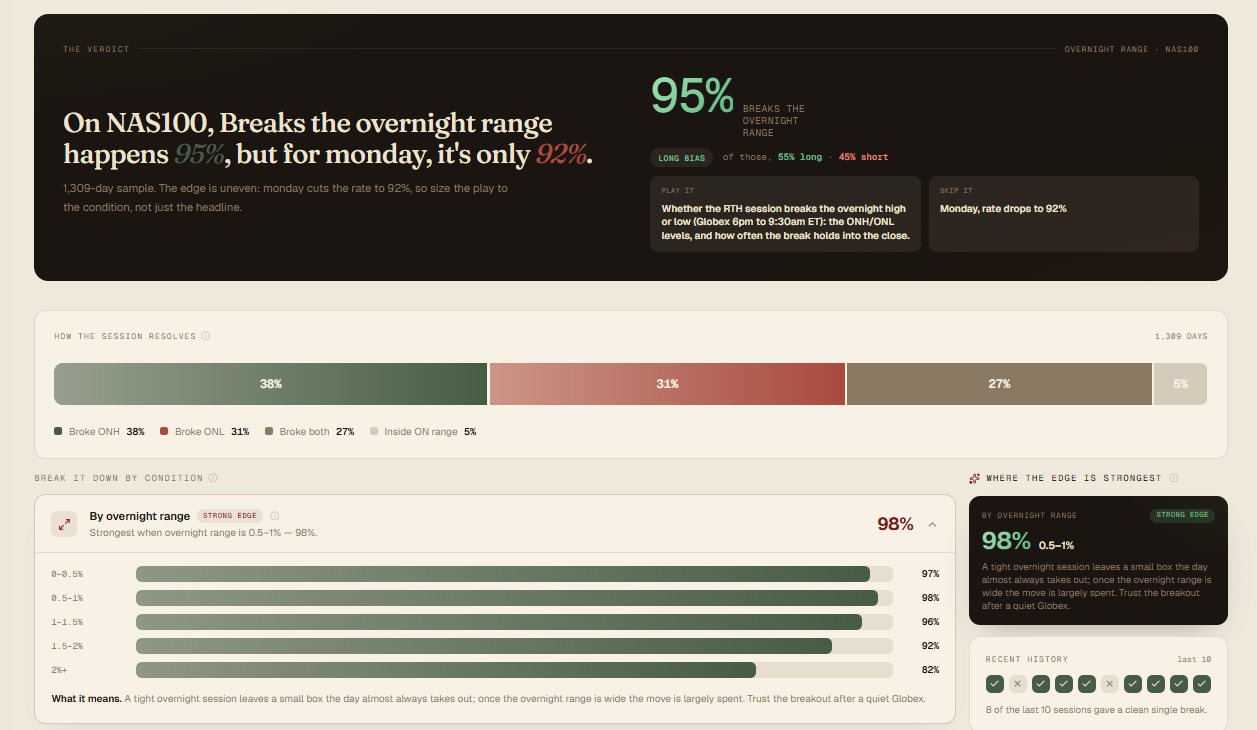
On a real trend day the first push is not a Judas Swing, it is the move. When price sweeps a side and keeps going instead of reversing, there was no trap, and forcing the fade is how you get run over. A wide, already volatile overnight is the warning: when the overnight range is over 2% of price it is broken and gone 82% of the time, with far fewer clean reversals.
Even a textbook sweep can reverse, tag your entry, and roll over again. That is why the stop sits beyond the swept wick and the entry waits for the structure shift, not the spike. It is a discretionary setup, and reading the reversal wrong is the cost of it.
Related strategies
You know the setup. Here is when it pays.
Market Edge tells you when a setup is worth trading and when it isn’t. Built on five years of real market history, it measures how any setup actually behaved, by day of the week, by time of day, by the state of the market, and shows the conditions where it paid and the ones where it didn’t. Same setup, very different odds depending on when you take it.
95% is the headline. The trade lives underneath it, in the conditions, so you take the version with the edge and skip the one that looks identical but isn’t.