All strategies
CompressionNAS100

Inside Bar Breakout

2 min read·Free·83% base rate · 802 sessions

An inside day is the market holding its breath. Price spends the whole session inside yesterday's high and low, volatility contracts, and stops pile up on both edges. That compression resolves, and on the Nasdaq it breaks out of yesterday's range 83% of the time. The only real question is which way.

An inside day is a session whose entire range fits within the prior day's high and low. It is a compression signal: the tighter the coil, the more energy behind the release. The play is to trade the breakout of the prior day's high or low, with the opposite side as your stop and a measured move as the target. Direction matters more than the break itself, and on the Nasdaq the upside break is the higher-quality side. When price closes above the prior high it holds more often than a close below the prior low does, so lean long unless the tape says otherwise.

The receipts83%
of 802 NAS100 RTH sessions, 2021–2026

This setup played out on NAS100 83% of the time, 6 years running.

of tracked NAS100 inside days break out of the prior day's range

This is how often it happens at all, not how often the trade wins. Where it plays out before your stop is the next question, and the one Market Edge answers below.

How to trade it

1Confirm today is an inside day: its range sits fully inside yesterday's high and low.
2Place your triggers at the prior day's high and low. A body close beyond one is the breakout.
3Stop on the opposite side of the range, and target a measured move of the prior day's range.
4Favour the upside. Historically the long break holds better than the short one, so demand more confirmation to sell.
5Skip the widest inside days. A coil that follows an already huge prior day breaks out the least often.
Two ways to run it

Draw it yourself, or let us draw it for you.

Draw it yourselfFree, forever

Everything you need is in the 5 steps above. No tool, no login, nothing held back.
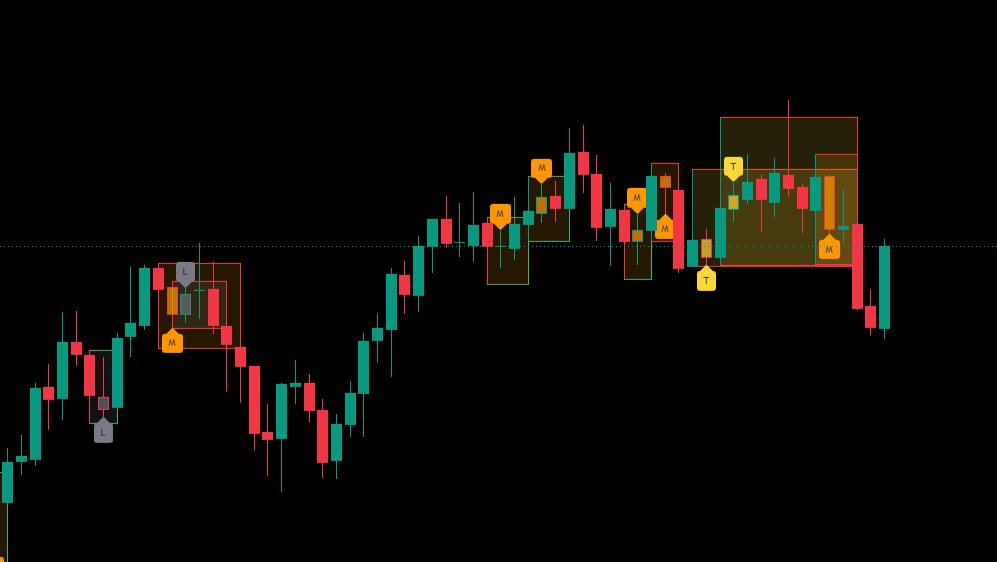
Confirm today is an inside day: its range sits fully inside yesterday's high and low.
Place your triggers at the prior day's high and low. A body close beyond one is the breakout.
Stop on the opposite side of the range, and target a measured move of the prior day's range.
Or let us draw it for youIncluded with Pro

Our indicator draws the range, its midpoint and the trade lines the moment the first hour closes, and alerts you when the setup is live. You focus on the trade, not the chart. It is included with Pro, no extra purchase.

See what you get with Pro

When it fails

The one inside day in six that stays trapped tends to follow a wide, exhausted prior day. After a 2%+ prior range the breakout rate falls to 72%; after a quiet one it climbs to 94%. Tightness is the whole tell, so weight the coils, not every inside day.

Compression cuts both ways: an inside day can break, suck in the breakout crowd, and snap back the other way. That is why the stop sits on the far side of the range, and why the upside break, which holds more often, is the side to trust.

Related strategies

Initial balance
The IB50
Market Edge

You know the setup. Here is when it pays.

Market Edge tells you when a setup is worth trading and when it isn’t. Built on five years of real market history, it measures how any setup actually behaved, by day of the week, by time of day, by the state of the market, and shows the conditions where it paid and the ones where it didn’t. Same setup, very different odds depending on when you take it.

83% is the headline. The trade lives underneath it, in the conditions, so you take the version with the edge and skip the one that looks identical but isn’t.
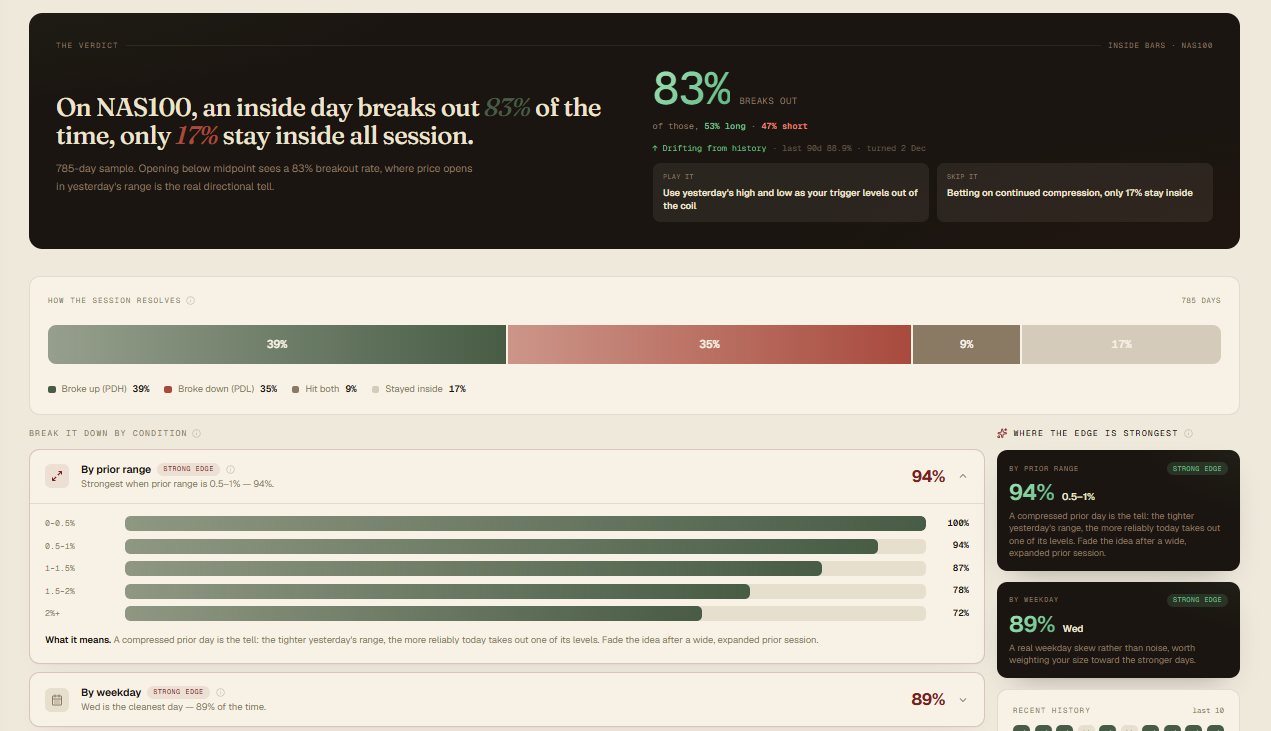
Prior day range 0.5–1%The tighter, the surer
94%
n = 172
An inside day after a quiet prior session breaks out 94% of the time. A tight coil almost always releases.
MondayMonday coils stick
73%
n = 154
Monday inside days break out only 73% of the time, the weakest day of the week. Early-week compression is slower to resolve.
Yesterday closed GreenGreen sets it up
86%
n = 403
After a green prior day, the inside day breaks out 86% of the time, a step above red.
Captured Market Edge panel, Compression, NAS100
From the Compression report · NAS100 · captured 21 Jul 2026Open the full NAS100 report
Included with Pro

Everything you need to trade compression, one plan.

Inside BarsThe indicator that draws and tracks this exact setup, live.
Market EdgeWhich setups to take, by day, session and size. The timing.
16 indicatorsThe whole library, every setup on this site, one login.
Start free No card required. Cancel anytime.

Start with the setup that fits you.

Read the strategies Browse the marketplace
[ tradestar ]Evidence for every serious trader. Broker sync, prop tracking, and edge stats in one workspace.
© 2026 Tradestar. Trading involves risk of loss.Historical stats, not predictions. Trade your own plan.