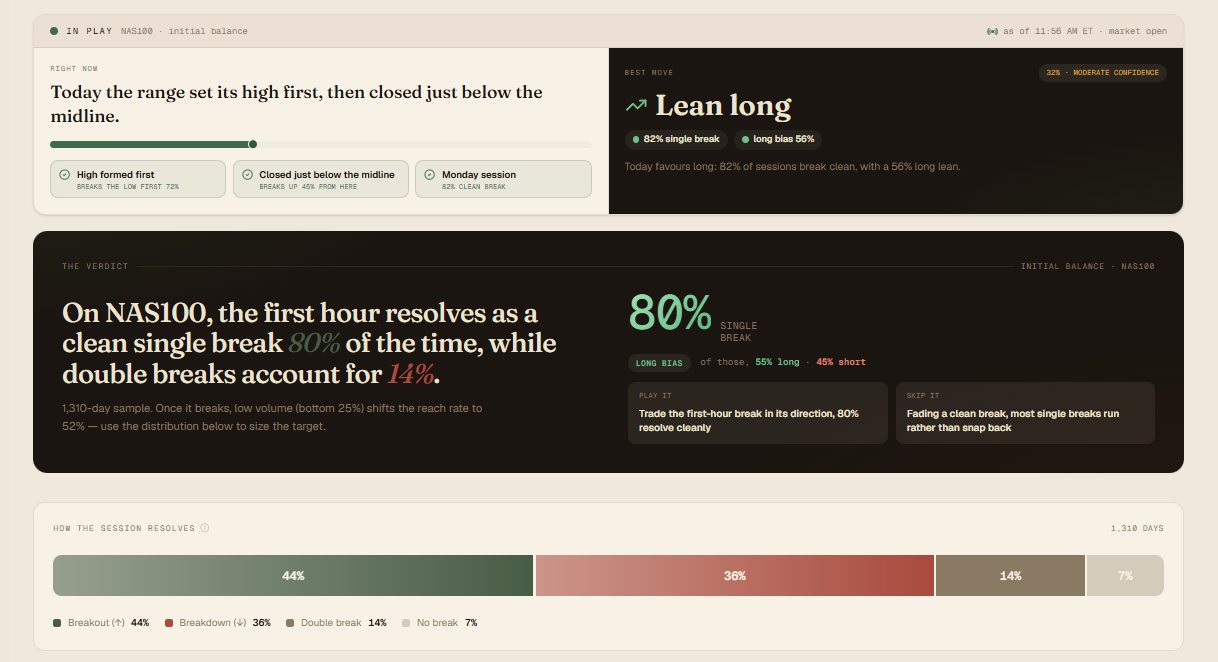
The Initial Balance is the high and the low of the first hour of trading. That first hour is when the day's biggest players commit, so the range they leave behind becomes the line the rest of the day trades around. Whether price breaks out of it, holds beyond it, or stays trapped inside tells you what kind of day you are in. It is one of the cleanest, most repeatable reads a trader can learn, and you only need two lines on a chart to use it.
By default we track it on the New York session's first 60 minutes on the Nasdaq, because that is where it is cleanest and best proven. But the idea works on any session and any instrument: take the first hour, mark its high and low, and you have an Initial Balance. From there every session is one of three things, a single clean break in one direction, a double break that takes both sides, or no break at all. Which extreme forms first hints at direction, the low printing before the high leans long, the high before the low leans short. The IB50 way to trade it is a resting order at the range's midpoint, with the stop and target measured off the range itself, so the whole trade is defined the moment the first hour closes. No guessing, no chasing.
How to trade it
Draw it yourself, or let us draw it for you.
Everything you need is in the 5 steps above. No tool, no login, nothing held back.
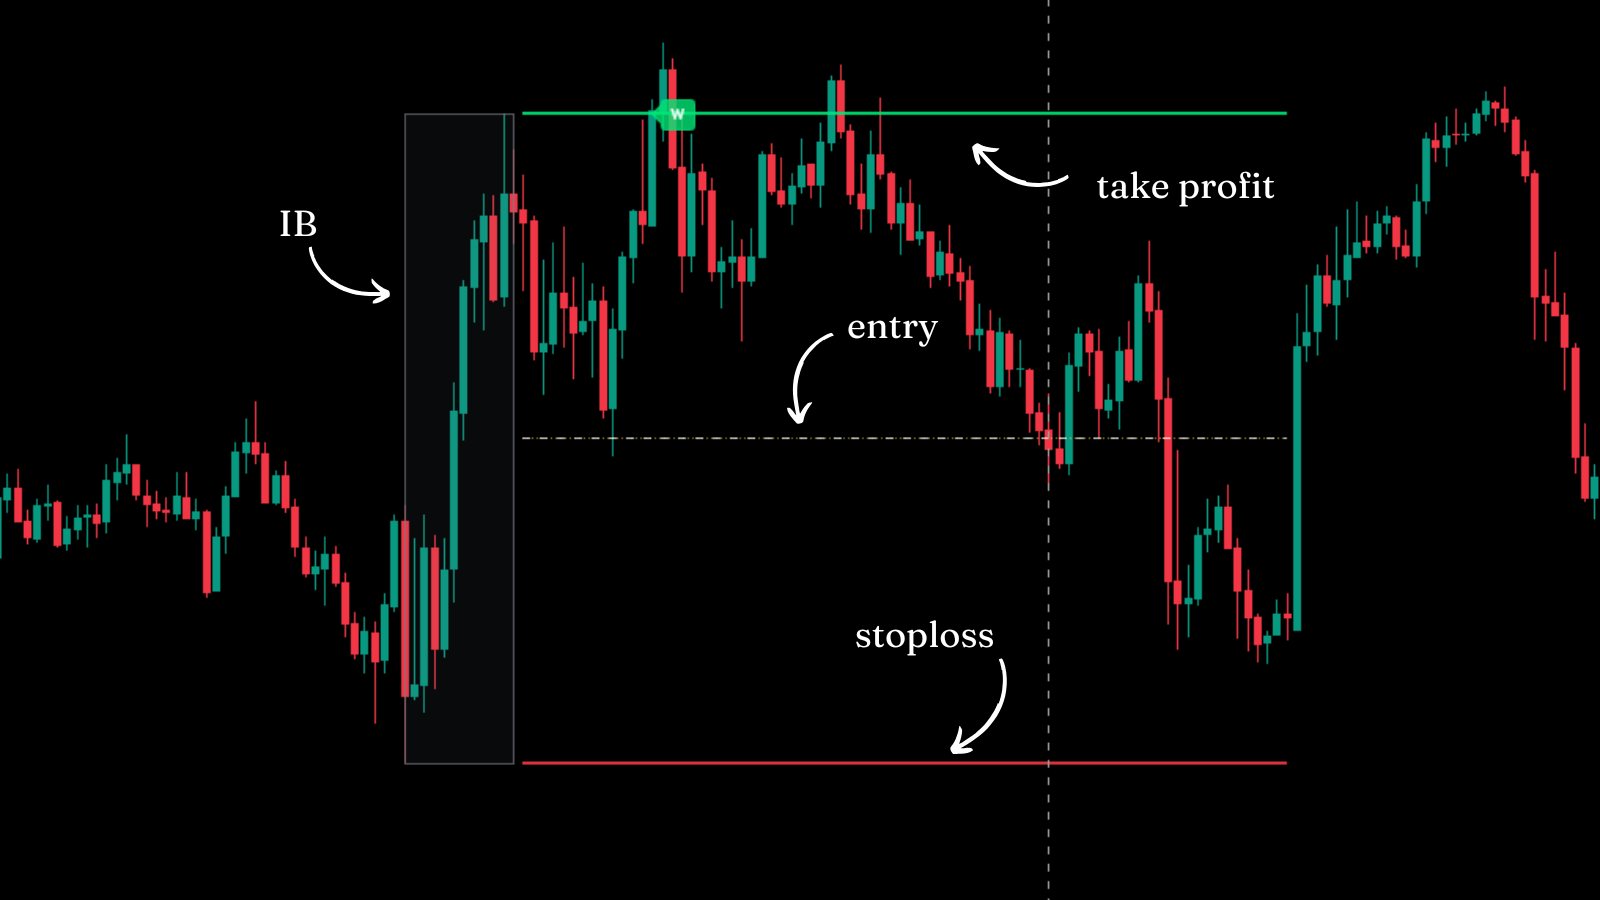
The IB50 indicator draws the Initial Balance, its midpoint and the trade lines the moment the first hour closes, and alerts you when the setup is live, so you watch the trade, not the chart. It is included with Pro, no extra purchase.
See what you get with ProWhen it fails
Roughly one NAS100 session in five gives a double break instead of a clean single one, both sides of the range taken out, usually on a high-volatility or news-driven morning the first hour cannot contain. A tight, indecisive opening range is the most prone to it: when the first hour spans only 0.5% to 0.75% of price, the clean-break rate slips to 73%.
Even on a clean single-break day the entry can fill and the stop can hit first. The midpoint entry with a defined stop caps that at planned risk, nothing more. It is a losing trade, not a broken edge.
Related strategies
You know the setup. Here is when it pays.
Market Edge tells you when a setup is worth trading and when it isn’t. Built on five years of real market history, it measures how any setup actually behaved, by day of the week, by time of day, by the state of the market, and shows the conditions where it paid and the ones where it didn’t. Same setup, very different odds depending on when you take it.
76% is the headline. The trade lives underneath it, in the conditions, so you take the version with the edge and skip the one that looks identical but isn’t.