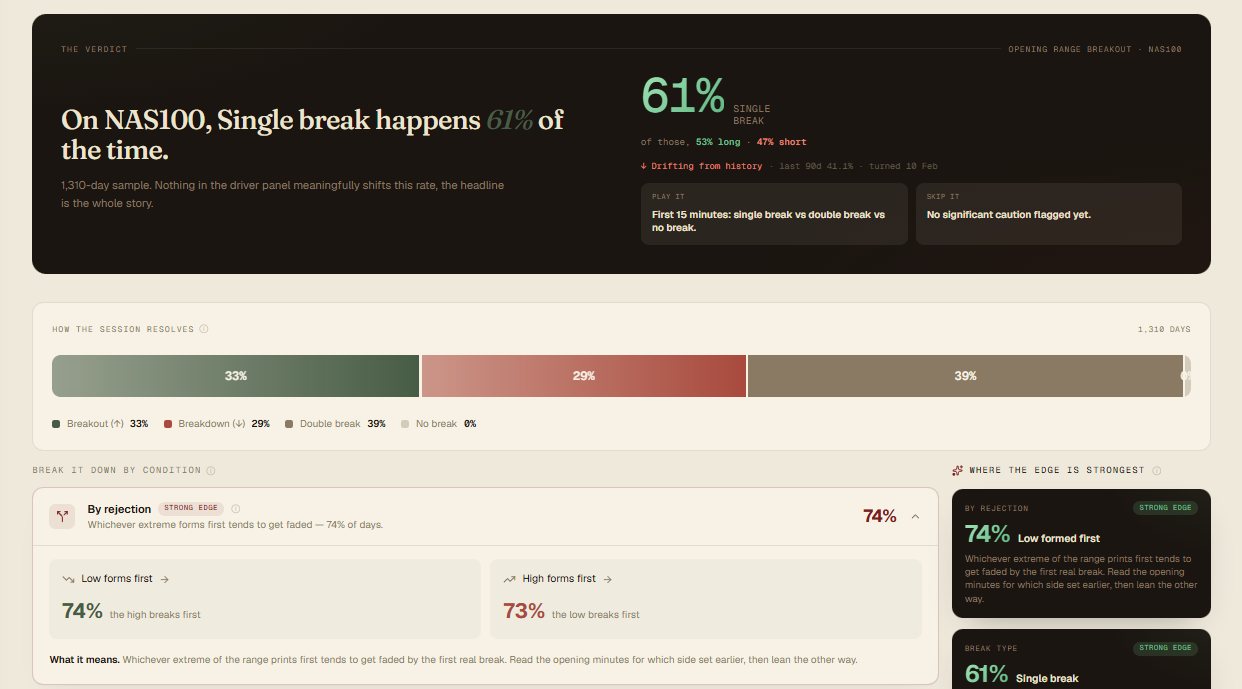
The opening range is the market's first fight of the day. In the first 15-30 minutes buyers and sellers mark out a high and a low, and everyone watches to see which side gives. The catch is that, more often than not, both sides give. Trading the opening range is less about the break and more about knowing which breaks are real.
The opening range is the high and the low of the session's first 15-30 minutes. Every session after gets classified against it: a single clean break in one direction, a double break that takes both sides, or no break at all. By default we track it on the New York cash open on the Nasdaq, because that is where it is most liquid and best proven, but the idea works on any session. The trap is that a 15-30 minute range is small, so a single spike can tag one side, snap back, and tag the other. That is why a raw break is close to a coin flip, and why the trade is a confirmed break, a body close beyond the range rather than a wick, in the direction the odds actually favour.
How to trade it
Draw it yourself, or let us draw it for you.
Everything you need is in the 5 steps above. No tool, no login, nothing held back.
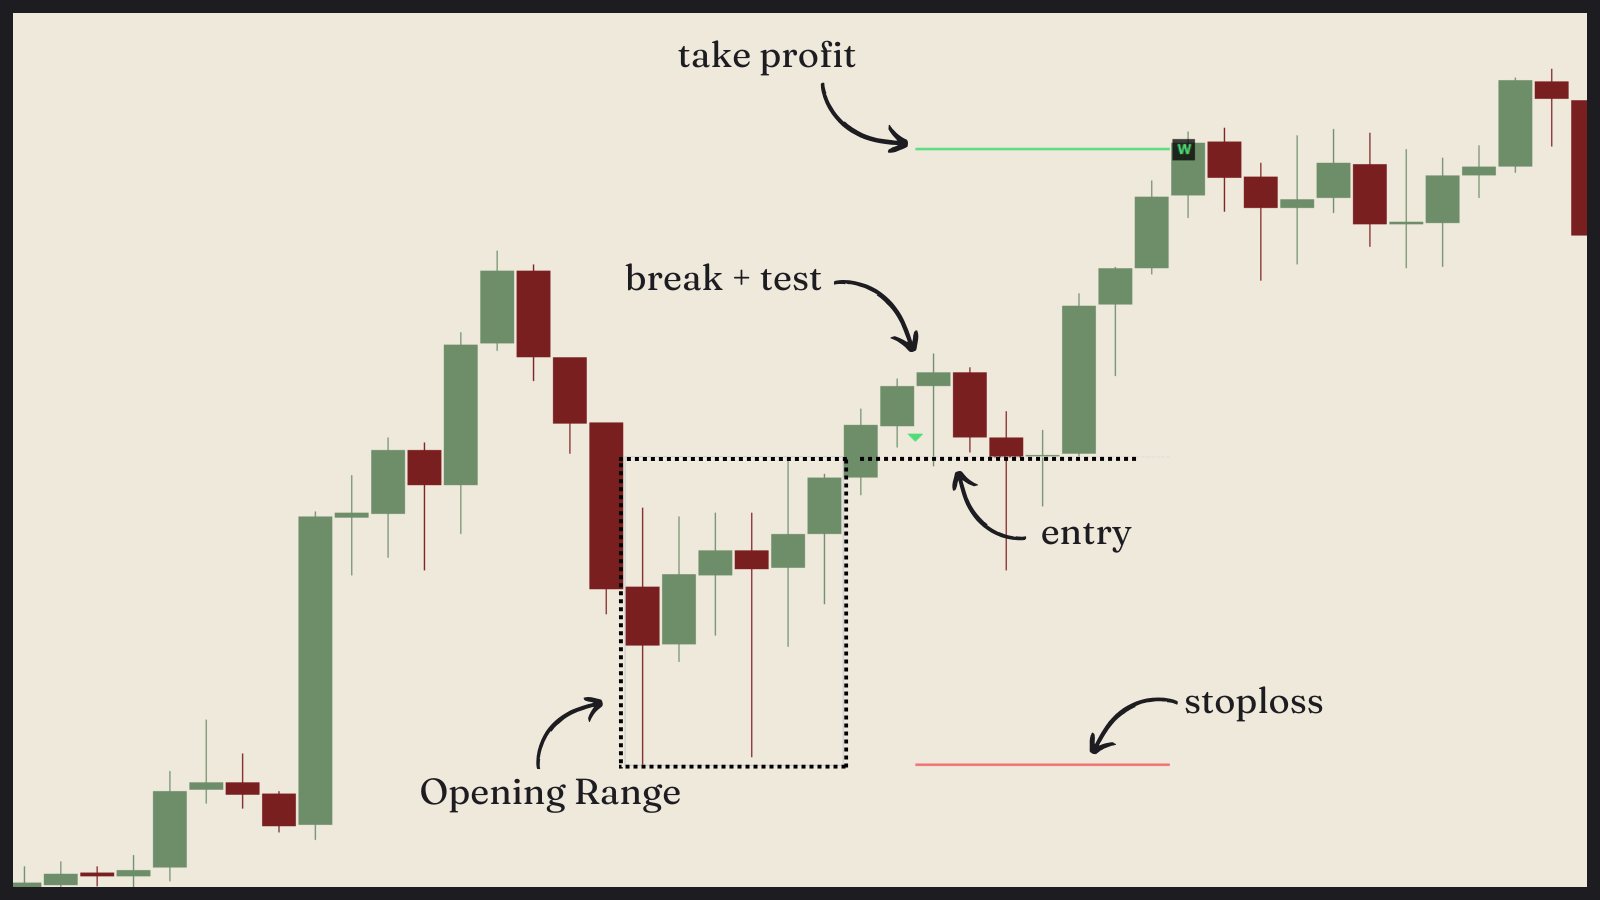
The ORB indicator draws the opening range and marks the confirmed break the moment a candle closes beyond it, so you are trading the close, not chasing the wick. It is included with Pro, no extra purchase.
See what you get with ProWhen it fails
Just over half of NAS100 sessions never give a clean single break at all; they double-break or stay trapped inside. A tight opening range is the worst offender: when the first 15-30 minutes span only 0.2 to 0.4% of price, the clean-break rate drops the furthest. Wednesday is the weakest day of the week at 40%. A tight range on a mid-week grind is noise, not a signal.
Even after a clean body close, price can snap back through the range and stop you before it runs. That is the cost of a coin-flip setup, and it is why the stop sits inside the range and the size stays small. It is a losing trade, not a broken edge.
Related strategies
You know the setup. Here is when it pays.
Market Edge tells you when a setup is worth trading and when it isn’t. Built on five years of real market history, it measures how any setup actually behaved, by day of the week, by time of day, by the state of the market, and shows the conditions where it paid and the ones where it didn’t. Same setup, very different odds depending on when you take it.
63% is the headline. The trade lives underneath it, in the conditions, so you take the version with the edge and skip the one that looks identical but isn’t.