TBR
Every other setup on this site keys off a price range that formed today. This one keys off a distribution. It asks how far this same window has travelled on previous days, draws a band that far from where the window opened, and bets that the first touch of it is a stretch that snaps back. It is the published AM time based range, generalised so the window, the sample and the band are all yours to set rather than fixed at one trader's preference.
A window opens a fixed number of minutes into the session and runs for a fixed duration. Its opening price is the anchor. For each of the last N sessions, take the window's percentage net change from its open to its close, and compute the sample standard deviation of those values. Scale that back into price using today's window open, and that is one sigma. The bands sit a chosen multiple of sigma above and below the open. The first touch of either band is the trade: a touch of the upper band is sold, a touch of the lower is bought, both with a resting limit at the band itself. The stop is a further multiple of sigma past the band. The target is measured from the window open in sigma, running past it in the direction of the reversion, so a target of zero is the opening price and a positive target is the excursion beyond it. The published study found the reversion rate falls hard by the hour, so how late after the window opens a first touch may still be faded is a first-class rule, not a refinement.
How to trade it
Draw it yourself, or let us draw it for you.
Everything you need is in the 6 steps above. No tool, no login, nothing held back.
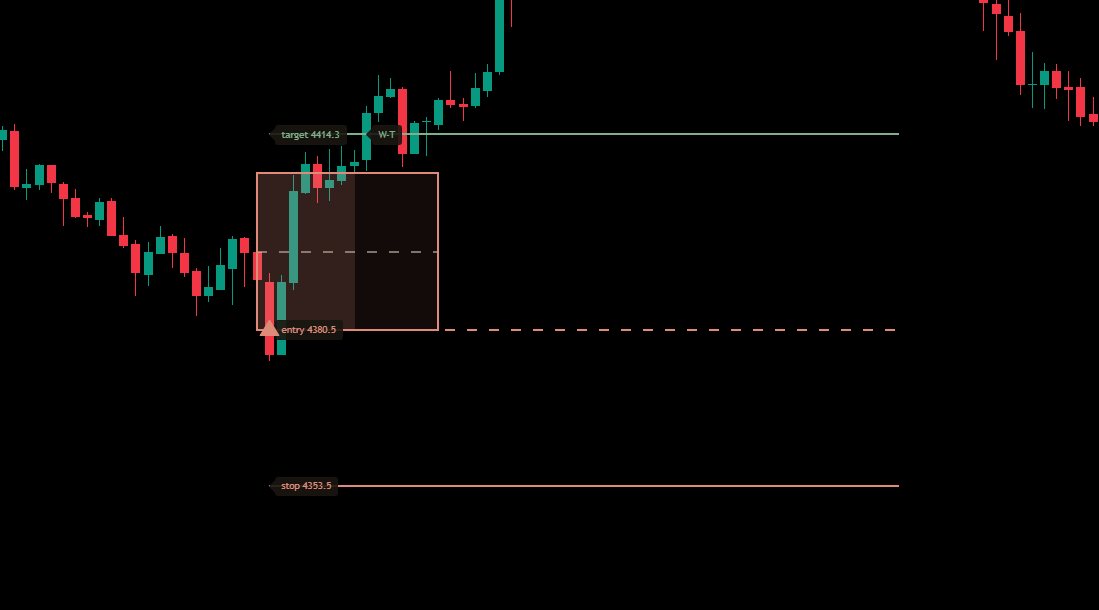
The TBR indicator keeps the rolling sample of window changes and computes the sample deviation itself, draws the bands at the window open only once the full sample exists, and fades the first touch inside the entry window at the band. It reports sigma in both deviations and price, because a band quoted only in sigma tells you nothing about how far away it actually is on your instrument today. It is included with Pro, no extra purchase.
See what you get with ProWhen it fails
A trend day touches the band and does not look back. On those days the first touch is not a stretch, it is the start, and the fade is stopped out by the same move that would have paid a breakout trader. The band cannot tell those days apart in advance, which is why the stop is a fixed multiple of sigma and not a hope. The edge also decays with the clock: the published rate is strongest in the first half hour after the window opens and weakens sharply by the third hour, so a touch that arrives late is a materially worse bet than one that arrives early, and the entry window exists to refuse it.
The limit fills at the band and the bar that filled it can keep running. Because this is a resting order filled mid-bar, the rest of that bar is genuinely live against the position and its stop counts, which is the honest way to treat a fill you did not choose the timing of. A reversion that gets most of the way back to the open and stalls is the ordinary loss here: it comes off at the window end a little green or a little red, and the target hit rate, which is not the win rate, is the number that tells you how often the trade actually completed.
Related strategies
The setup is yours. Knowing where it holds is the hard part.
Edge Lab sweeps the reversion window across every market and session it has data for, so you can see which bands get filled and which ones price runs straight through. It separates the trades that reached the target from the ones that came off at the window end a little green, which on this setup is the difference between an edge and a flattering win rate.